|
By Avery Hinks Starting around age 60, noticeable changes in muscle function often manifest. It’s January here in Guelph, Ontario, so I’ll use a winter example. You awake after a night of snowfall and need to clear your driveway. As you do so, you might notice it’s harder to shovel snow. The salt bags you use to spread salt might also feel heavier than they used to. When you’re done, on your way back up your front step, you might slip on a patch of ice, and notice your limbs move slower to catch your fall.  These impairments in muscle function stem from the fundamental biomechanics of your muscles. Specifically, the abilities to produce force, velocity, and power. Several changes associated with aging contribute to these impairments. Namely, there are changes in the connection between the brain and the muscles, the biochemical processes occurring in the muscles, and the muscles' structure.  To make this knowledge translation a digestible length, I will focus only on how changes in muscle structure contribute to deficient muscle function in old age. The other contributors will I’m sure be covered in a future knowledge translation! What does a muscle look like, structurally?Whether you are younger or older, the structure of any of your muscles can be viewed as a hierarchy. Think of a muscle’s structure as an inverted pyramid.  At the top, there is the muscle as a whole. Looking closer, many smaller structures called muscle fascicles comprise that whole muscle. I say “smaller,” but muscle fascicles are easily visible without a microscope. The next time you cook chicken for dinner, pay close attention as you slice it. You will be able to see distinct lines running through the meat. Those are fascicles! There are mainly two properties we measure regarding muscle fascicles. In the image below, you can see that the fascicles are at an angle to the borders of the muscle. We call this the “pennation angle.” We also measure the “fascicle length,” which is exactly how it sounds: the length of a fascicle from end to end. At this level of muscle, we can also characterize structure with "muscle thickness," which provides an indication of muscle size. In humans, these measurements are usually captured using ultrasound, as shown below. 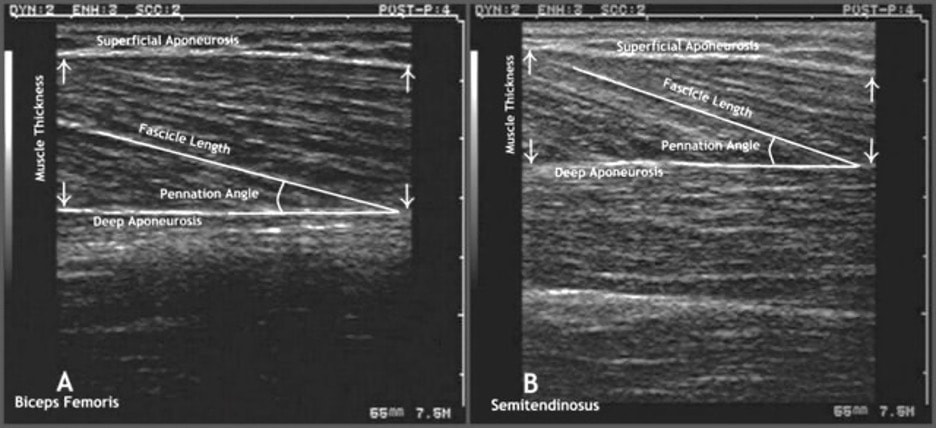 Figure from Oliveira et al. (2016), Research on Biomedical Engineering. To appreciate the relationship between muscle fascicle length, pennation angle, and thickness, we can think in terms of geometry. For a fascicle to be longer, there must be a smaller pennation angle, or the thickness of the whole muscle must increase, keeping pennation angle the same. 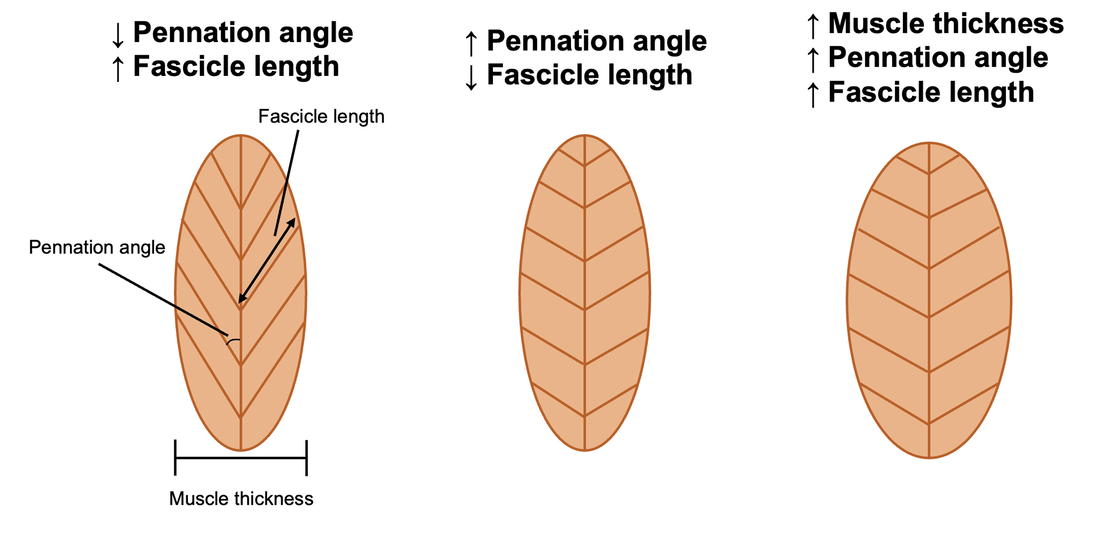 Going further down the pyramid, a muscle fascicle is comprised of many muscle fibres. A muscle fibre is comprised of the tiny structures that allow a muscle to produce force. These structures are called sarcomeres.  When you activate your muscle for a required task, proteins in the sarcomere called myosin and actin bind together. These proteins then pull the outer edges of the sarcomere closer together to generate force. Right now, look at your bicep muscle and flex it. Do you see how it becomes shorter and more tense? That is the result of thousands of sarcomeres in your bicep contracting altogether. 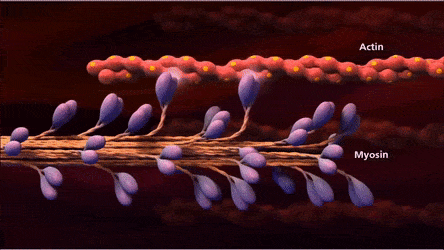 We can look at the arrangement of sarcomeres in a muscle fibre in two ways. First, they are arranged along the fibre’s length, in the direction that sarcomeres pull when producing force. The number of sarcomeres from end to end along a muscle fibre is called the “serial sarcomere number”. Second, sarcomeres are arranged side to side, parallel to each other in the muscle fibre. We call this (unsurprisingly) the “parallel sarcomere number.” A greater serial sarcomere number means a muscle fibre is longer, while a greater parallel sarcomere number means a muscle fibre is wider. 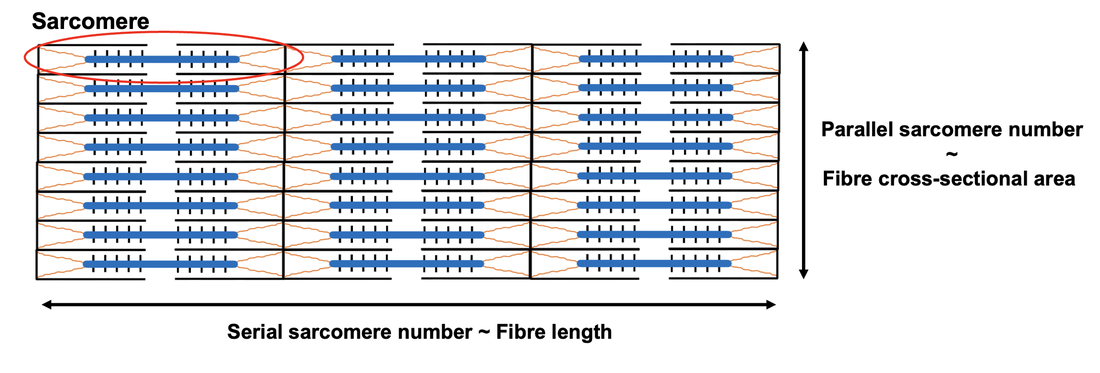 Considering the pyramid of muscle structure, we can appreciate that serial and parallel sarcomere number can influence the appearance of muscle structure at a larger scale. Serial sarcomere number contributes to a muscle’s fascicle length, while parallel sarcomere number contributes more to a muscle’s pennation angle and thickness. What does muscle structure mean for muscle function? There are arguably three main measures to consider when discussing fundamental muscle function. First, there is strength, which is measured as maximum force production. Second, there is speed, which is measured as a muscle's maximum shortening velocity. Lastly, there is power output, which combines strength and speed together. Each of these measures is influenced by muscle structure. Picture yourself trying to pull a giant rock with a rope. Seems hard, right? Well, what if other people join in, each pulling from their own rope, parallel to yours? It will become easier because your pull altogether is stronger than one person alone. 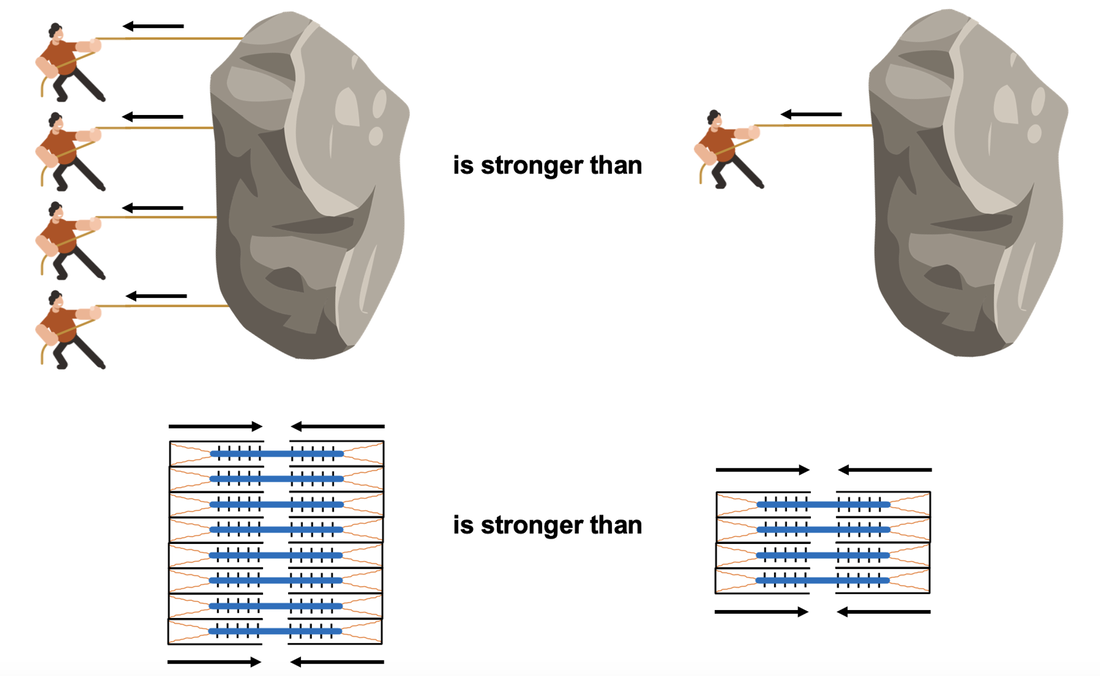 When sarcomeres contract so your muscle can lift an object, it works the same! With more sarcomeres in parallel (and on a larger scale, greater pennation angle), your muscle can produce more force. Opposite to parallel sarcomere number, serial sarcomere number instead contributes to maximum velocity. This relationship is best demonstrated with math. I’ll walk you through it. While a muscle typically has thousands of sarcomeres in series, below are two hypothetical muscles: one with three sarcomeres, and one with six. As well, sarcomeres are very small (about 2 thousandths of a millimetre), but for the sake of making the math easy, let’s say each sarcomere is 1 millimetre long. 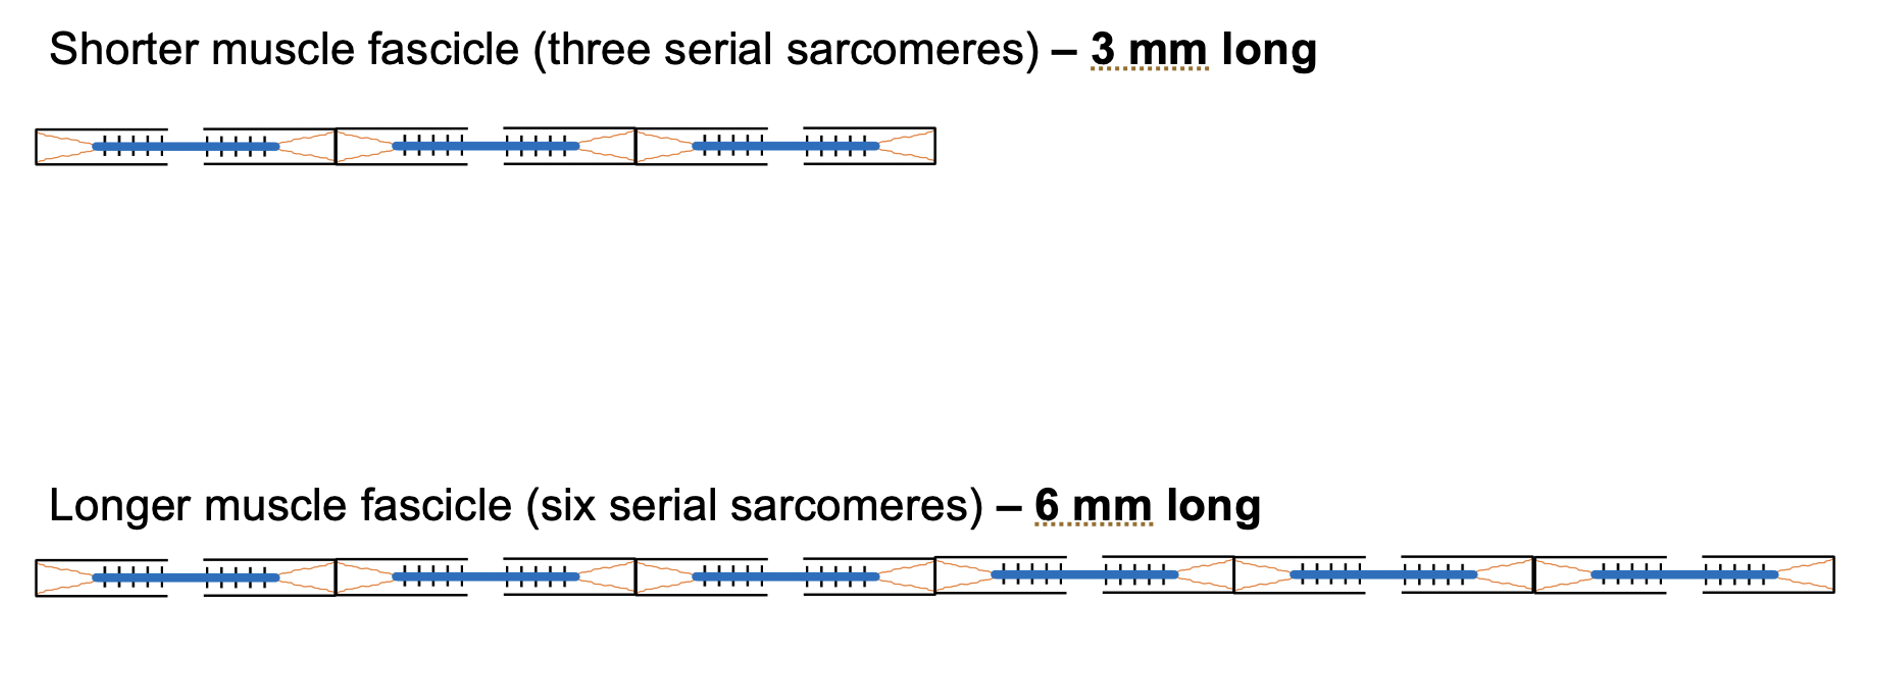 Now let’s say each sarcomere shortens to half its original length, as shown below. Velocity is measured in units of distance over time, so we’ll also say this shortening occurs in 1 second. 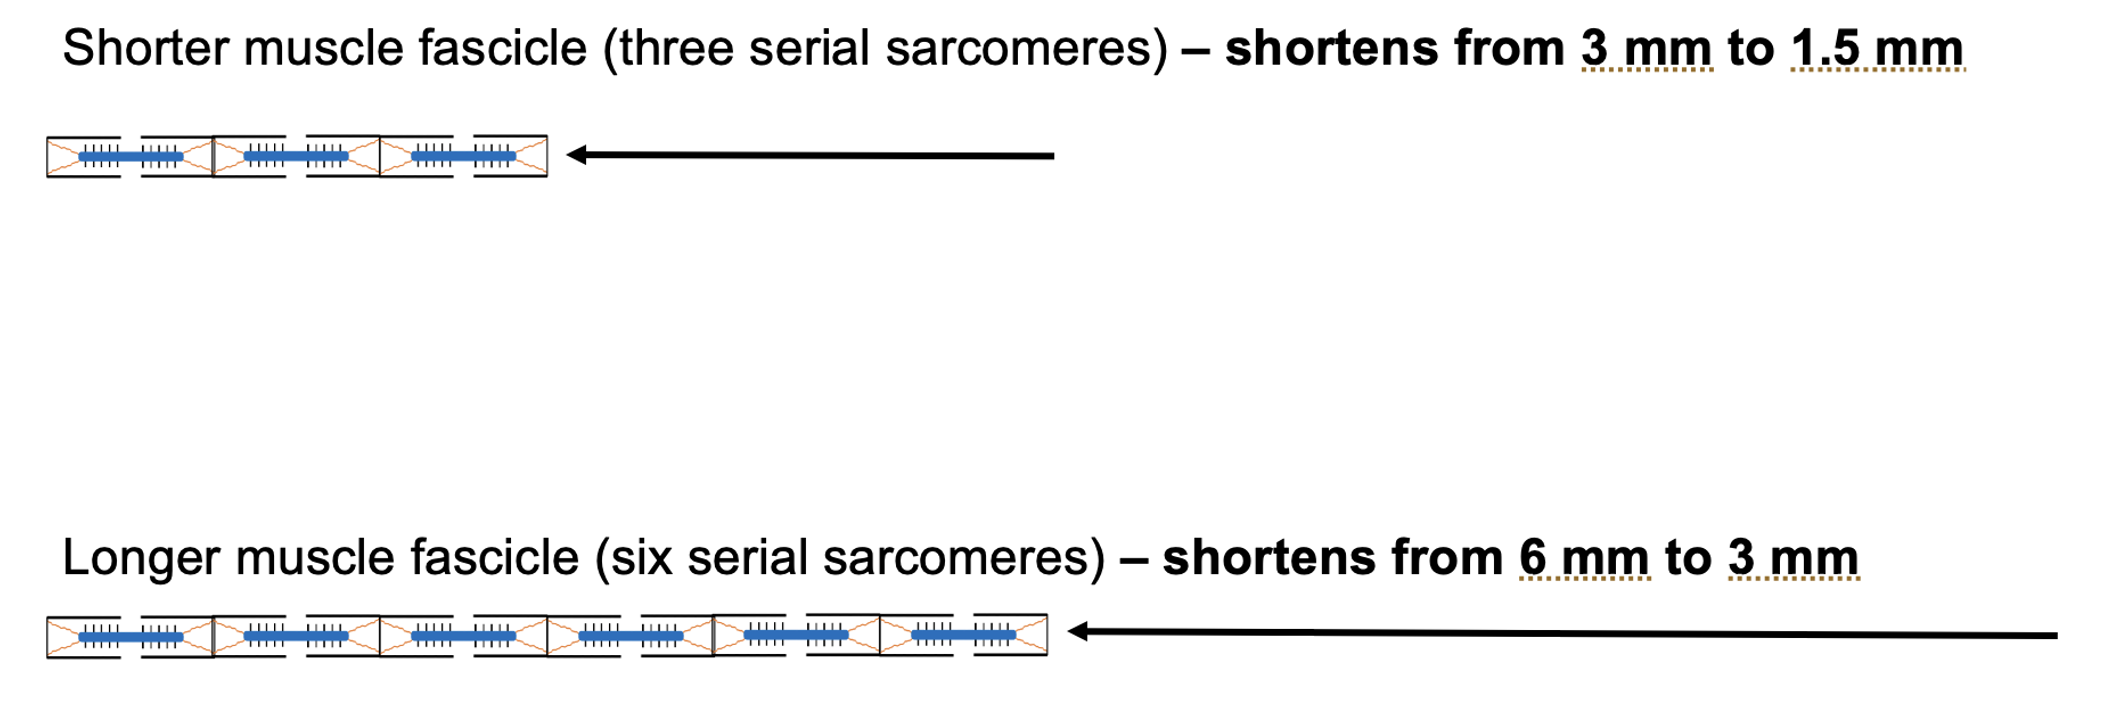 The shorter fascicle (top) shortened from 3 mm to 1.5 mm in 1 second, giving it a velocity of 1.5 mm/s. The longer fascicle (bottom) shortened from 6 mm to 3 mm, giving it a faster velocity of 3 mm/s. This example shows that for the same amount of shortening in each sarcomere, a muscle with more serial sarcomeres can shorten faster! Lastly, there is maximum muscle power output. Simply put, power is equal to force times velocity. Therefore, muscle power is important in tasks involving both strength and speed. For example, when jumping as high as you can.  Remember, parallel sarcomere number contributes to maximum force production, and serial sarcomere number contributes to maximum shortening velocity. Therefore, both these aspects of muscle structure are important in maximum muscle power. How does muscle structure change with age?A study by Narici and colleagues in 2003 was one of the first to show how muscle structure changes in old age. They showed that 70 to 81 year old men had 10% shorter fascicles and 13% smaller pennation angles in a muscle of the lower leg (the calf) than 27 to 42 year old men. Since then, several other studies have observed similar results in other muscles, and also in women. 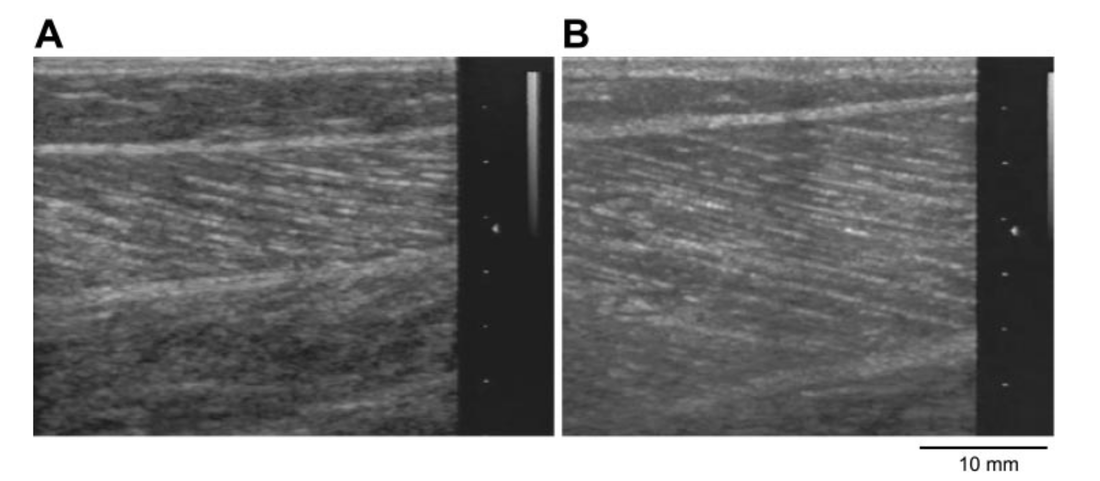 "A" shows an ultrasound image of the muscle structure of an older man, while "B" shows that of a younger man. Figure from Narici et al. (2003), Journal of Applied Physiology. Given these changes in muscle structure, the functional changes observed in old age are not surprising. A study by Hughes and colleagues in 2001 assessed strength of the knee extensor (kicking) muscles in 120 individuals ranging from 46 to 78 years old. They showed the strength of these muscles declines 14% per decade of life on average. Similar declines have also been observed for maximum shortening velocity and power output. The figure below shows muscle shortening velocity and power when lifting a range of weights (“Load” on the graphs) in young, old, and very old men. This figure demonstrates clear reductions in both muscle speed and power throughout the lifespan. 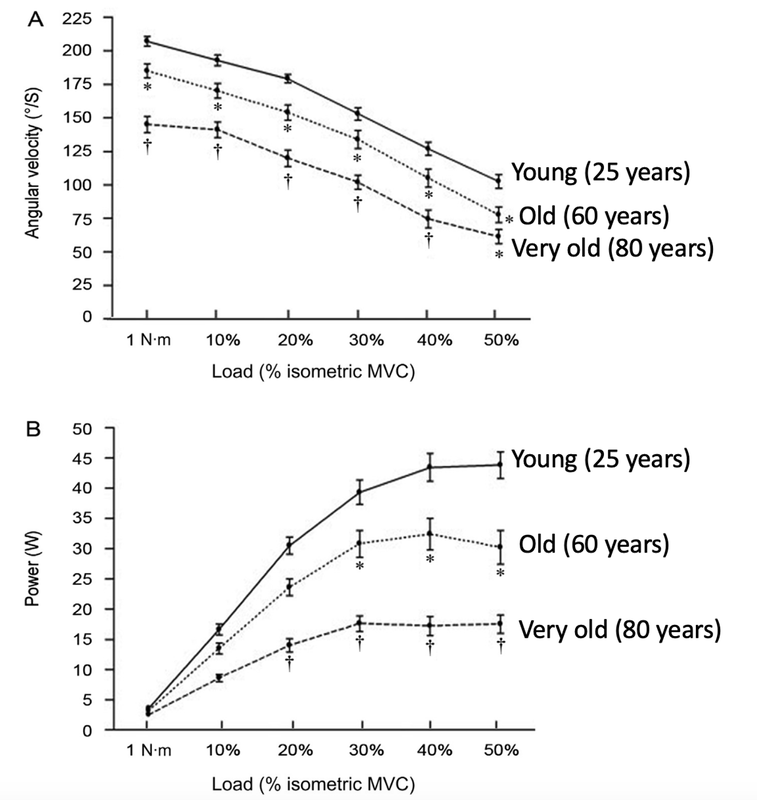 Figure from McNeil et al. (2007), Journal of Applied Physiology. Similar results for muscle speed and power were also shown in women in a study by Macaluso and colleagues. Older women had a 21% slower maximum velocity and generated 61% less power in their legs than younger women. 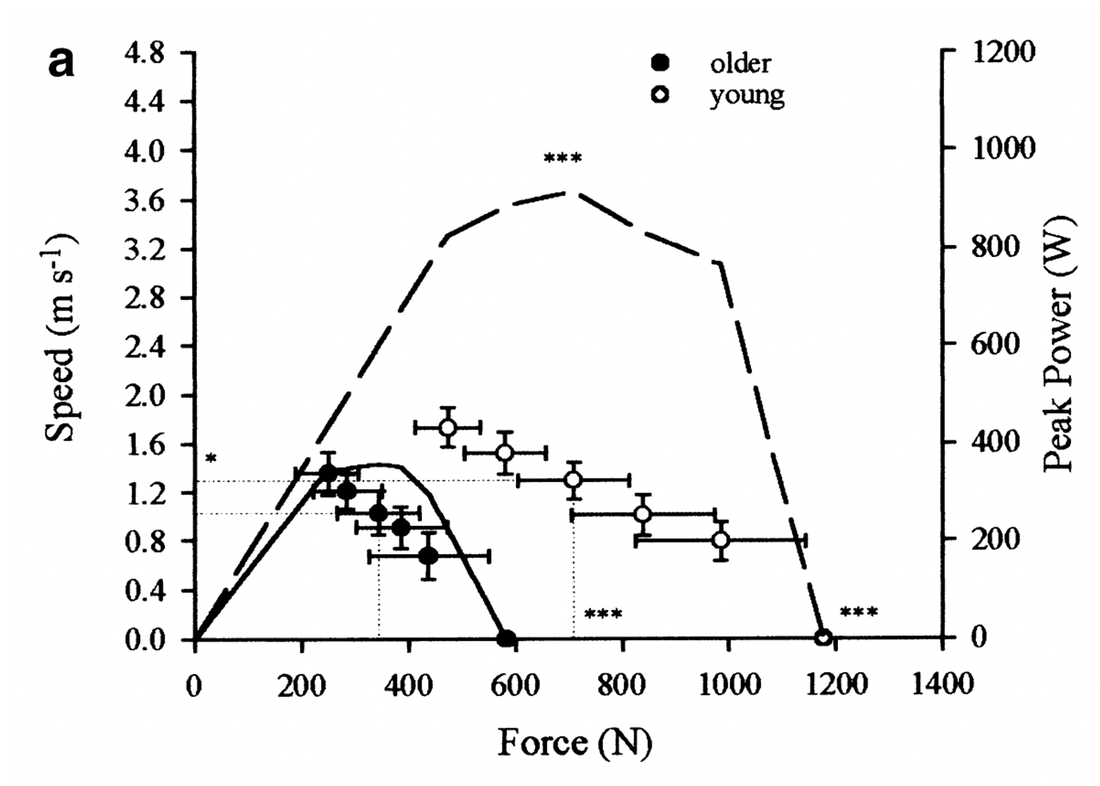 Solid line = peak power of older women. Dashed line = peak power of young women. Black dots = speed of older women. White dots = speed of young women. Figure from Macaluso et al. (2003), European Journal of Applied Physiology. Is there any hope?Of course!  Returning to the study that investigated 120 subjects by Hughes and colleagues, one of their figures sticks out.  Figure from Hughes et al. (2001), Journal of Gerontology. The figure above shows strength reductions in the men and women investigated in Hughes’ study in four different muscle groups. The percentage values represent the proportion of individuals who did not exhibit declines in strength over time. This likely depends on lifestyle. In other words, the old saying, “Use it or lose it,” holds merit. To that end, many studies have depicted figures like the one below, showing how exercise can delay the reduction in muscle strength (and with it, the onset of frailty) with aging.  Figure from Booth and Zwetsloot (2009), Scandinavian Journal of Medicine and Science in Sports. It is clear that training earlier in life can delay the decline in muscle strength. With that said, positive adaptations in muscle structure and function are still possible in old age. For example, a study by Reeves and colleagues in 2004 submitted older men and women (on average 74 years old) to resistance training of the legs 3 days per week for 14 weeks. This training program resulted in a 10% increase in maximum leg strength. Correspondingly, this training program induced a 10% increase in fascicle length and a 30% increase in pennation angle in one of the leg muscles.  Conclusion As we age, our muscles experience decreases in fascicle length and pennation angle. These changes in muscle structure likely contribute to the impairments in muscle strength, velocity, and power output seen in old age. Resistance training earlier in life can delay these changes in muscle structure and function—but perhaps more importantly, resistance training during old age can also reverse these changes to an extent. Our lab is currently looking into the distinct links between changes in muscle structure and changes in muscle function—and their adaptability with training—in old age.
If you are on the older side, and find yourself feeling weak shovelling your driveway after a snowstorm, I hope you have learned that you still have the capacity to grow stronger! References Booth, F. W., & Zwetsloot, K. A. (2010). Basic concepts about genes, inactivity and aging. Scandinavian journal of medicine & science in sports, 20(1), 1-4. Hughes, V. A., Frontera, W. R., Wood, M., Evans, W. J., Dallal, G. E., Roubenoff, R., & Singh, M. A. F. (2001). Longitudinal muscle strength changes in older adults: influence of muscle mass, physical activity, and health. The Journals of Gerontology Series A: Biological Sciences and Medical Sciences, 56(5), B209-B217. Macaluso, A., & De Vito, G. (2003). Comparison between young and older women in explosive power output and its determinants during a single leg-press action after optimisation of load. European journal of applied physiology, 90(5), 458-463. McNeil, C. J., Vandervoort, A. A., & Rice, C. L. (2007). Peripheral impairments cause a progressive age-related loss of strength and velocity-dependent power in the dorsiflexors. Journal of applied physiology, 102(5), 1962-1968. Narici, M. V., Maganaris, C. N., Reeves, N. D., & Capodaglio, P. (2003). Effect of aging on human muscle architecture. Journal of applied physiology, 95(6), 2229-2234. Oliveira, V. B. D., Carneiro, S. P., & Oliveira, L. F. D. (2016). Reliability of biceps femoris and semitendinosus muscle architecture measurements obtained with ultrasonography. Research on Biomedical Engineering, 32, 365-371. Reeves, N. D., Narici, M. V., & Maganaris, C. N. (2004). In vivo human muscle structure and function: adaptations to resistance training in old age. Experimental physiology, 89(6), 675-689.
0 Comments
|
AuthorAvery Hinks Archives
September 2023
Categories |
 RSS Feed
