|
By Avery Hinks Lifting heavy weights, in or outside of the gym, involves both a lifting and a lowering phase. The lifting phase is called a concentric contraction, with your muscle shortening to move the weight against gravity. To then put the weight back down, your muscles perform an eccentric contraction, now lengthening back to their starting position as you control the weight’s descent. Researchers have spent years understanding the distinct influences of these two types of muscle contractions on performance. In general, training focusing on concentric contractions makes a muscle wider to emphasize strength. Eccentric training, conversely, makes a muscle longer, ideally to improve its speed and range of motion. 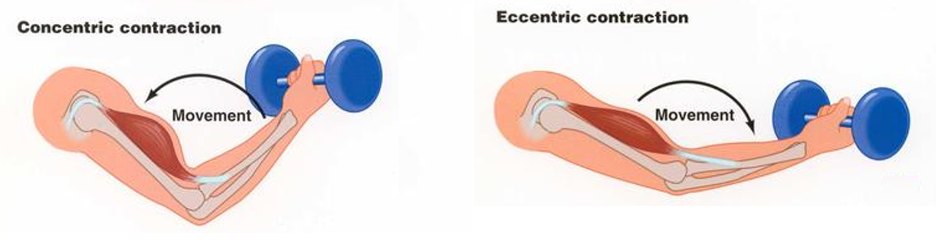 This all applies to what we call “skeletal muscles.” Those are muscles that connect one bone to another to allow your body to move. There is one muscle in the body, though, that contracts more than any muscle in your arms or legs, working constantly throughout your life, yet it does not connect bones together. I’m talking about the heart. The heart has no way of lifting or lowering weights, so the concentric vs. eccentric training paradigm described above wouldn’t apply to it, right? Actually, you can in fact train your heart both concentrically and eccentrically, and it’s less complicated than you might think (I see that image in your head of you trying, impossibly, to use your heart to lift a dumbbell). Allow me to explain… What does the heart do?The heart maintains the flow of blood to all the tissues of the body, including muscles, digestive organs, the skin, and the heart itself. Without blood flow, there would be no way for these tissues to receive the oxygen and nutrients they need, nor a way to have their waste products removed. These processes are necessary whether we are exercising or at rest. Sounds like it could be complicated, but thankfully blood flow is captured by a simple equation: Q = HR x SV In the equation above, HR represents heart rate, which is the number of times the heart beats in one minute. SV is stroke volume, which describes the volume of blood ejected by the heart on each beat. Putting these together, Q is our “cardiac output”: the volume of blood in litres pumped by the heart in one minute. In humans, normal cardiac output at rest is about 5 litres of blood per minute. To regulate the pumping of blood, the heart is divided into four chambers. On the top are the smaller right and left atria, and on the bottom are the larger right and left ventricles, as pictured below. 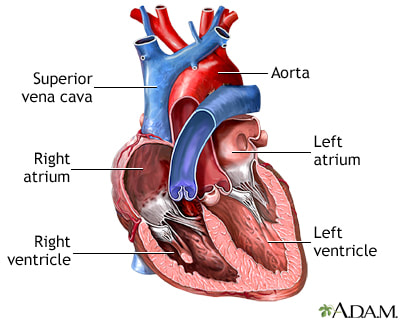 Blood enters the heart through the atria, then as the heart relaxes, that blood passes into the ventricles. The heart then contracts, and the ventricles pump blood to the lungs (right ventricle) to pick up oxygen, and to the rest of the body (left ventricle) to deliver oxygen. The heart contracts from the bottom up in a twisting motion, kind of like ringing water from a cloth. That twisting motion squeezes blood out of the ventricles and into circulation.  From the paragraph above, we can pick out two crucial factors that determine how much blood the heart can pump: contraction and relaxation. The heart’s ability to contract is important because a weaker contraction means less blood is ejected (in other words, stroke volume is lower). If the heart also has trouble relaxing, not enough blood will flow into the left ventricle from the left atrium in the first place. These limitations aren’t much different from how we view skeletal muscles. Weakness in the muscles of our arms and legs limit how much we can lift. If we also can’t relax those muscles, they become fatigued, more rigid, and overall less efficient. On a molecular level, heart and skeletal muscle are similarHeart muscle fibres and skeletal muscle fibres possess fundamentally the same molecular structure. Both are comprised of thousands of small units called sarcomeres. Each sarcomere contains the proteins actin, myosin, and titin, which generate force. Both heart and skeletal muscle fibres are also wrapped in structures called the sarcolemma and sarcoplasmic reticulum which together convert electrical signals into the chemical processes that incite muscle contraction. They also both contain mitochondria for the production of ATP for energy, and a nucleus to control gene expression. 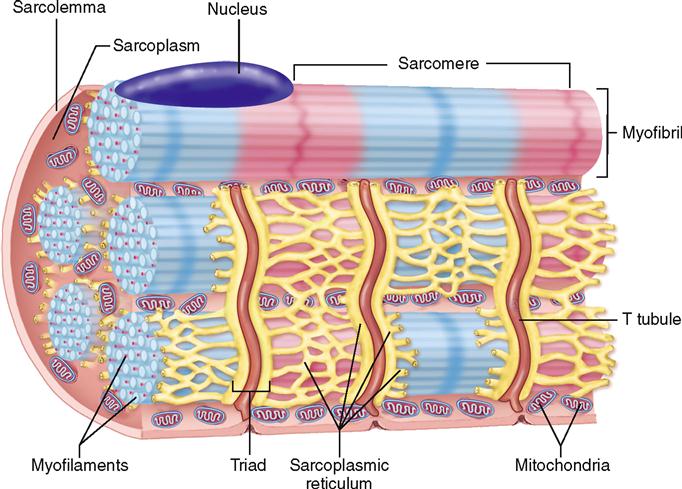 To perform its distinct actions, however, muscle fibres of the heart bear some differences to skeletal muscle fibres. Heart muscle fibres are shorter and more branched amongst each other, allowing them to better contract as a unit to eject blood. Adjacent heart muscle fibres are also connected by structures called intercalated discs. Intercalated discs transmit currents from one fibre to the next, further synchronizing the efforts of all fibres together. 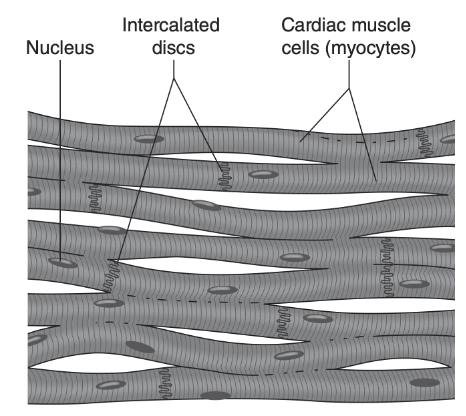 If heart muscle and skeletal muscle are so similar, does that mean we can train heart muscle like skeletal muscle? Concentric and eccentric training of heart muscleThe heart’s stroke volume is modified by both a preload and an afterload. Preload refers to the volume of blood that fills the left ventricle. Afterload is the pressure in the aorta that the left ventricle must push against when it contracts to eject blood. The distinct stimuli provided by preload and afterload are what distinguish between eccentric and concentric training of the heart. 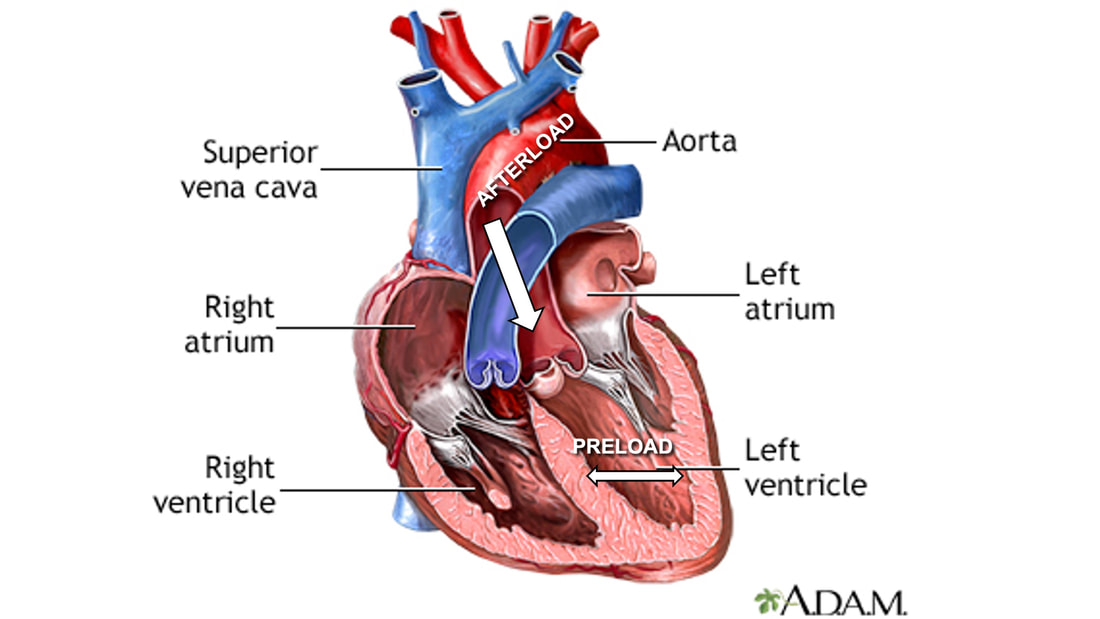 Endurance training includes any form of exercise with sustained movement for a long duration—exercises like jogging, cycling, or rowing. During these exercises, muscles go through cycles of contraction to create what’s called a muscle pump. When muscles contract, they compress the veins around them, pumping blood back the heart. Many continuous cycles of this muscle pumping action increases the overall amount of blood that returns to the heart. In other words, it increases the preload. The left ventricle stretches to accommodate this increased preload, creating a volume stimulus not unlike an eccentric contraction stimulus for skeletal muscles. If endurance exercise is repeated consistently over time, the heart remodels accordingly. 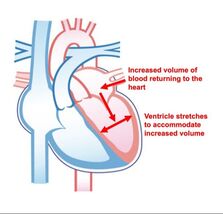 “Eccentric hypertrophy” of the heart is marked by an increase in the cavity size of the left ventricle. This increased cavity size accommodates the increased filling during endurance exercise. At the same time, there is also a proportional increase in the thickness of the muscle surrounding the left ventricle to ensure the left ventricle’s contractility is maintained with its larger size. Together, these adaptations amount to an increase in stroke volume. In other words, the heart becomes capable of ejecting more blood with each beat. 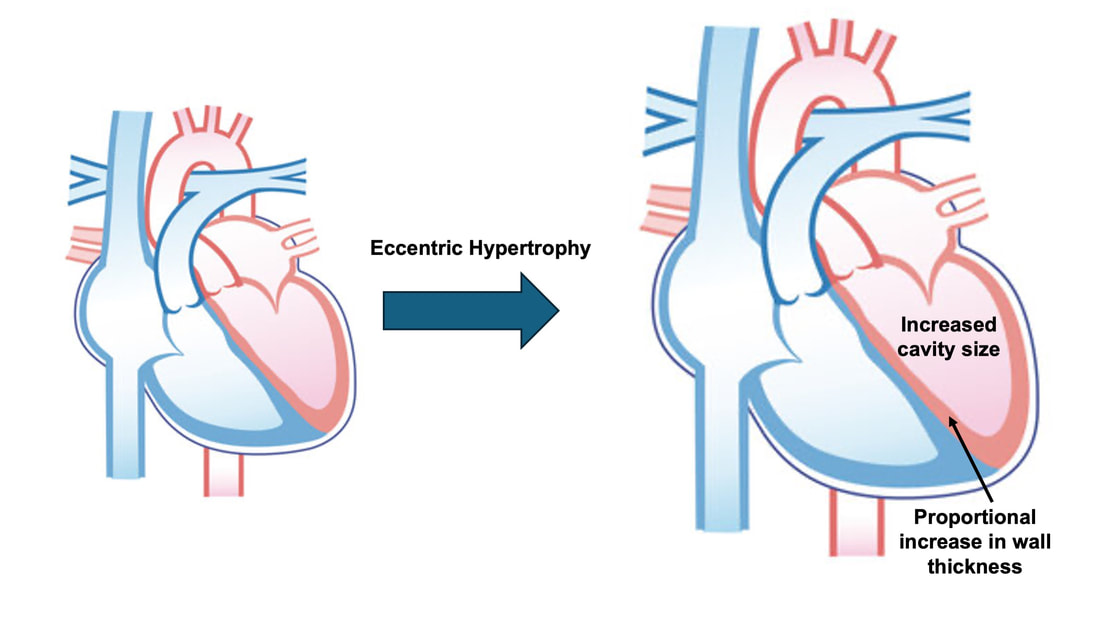 “Concentric hypertrophy” of the heart involves increasing afterload. This stimulus happens with resistance training—any form of exercise involving intermittent, high intensity muscle contractions that cannot be sustained for long. The most prominent example is weightlifting. When we lift heavy weights, we perform what’s called a “Valsalva maneuver.” Think of a time you lifted something heavy. Do you remember briefly holding your breath, clenching all the muscles of your torso, and breathing out forcefully as you performed the hardest part of the lift? That forceful exhale is the Valsalva maneuver. Valsalva is not necessarily bad, though—we do this as a natural tendency to stabilize our bodies to prevent injury. The Valsalva maneuver creates a large increase in pressure around the heart, which, of course, increases the afterload in the aorta. The left ventricle must then contract harder to pump blood out. If we repeat this type of exercise over time, we create a pressure stimulus on the heart similar to the concentric contraction stimulus we can give skeletal muscles. 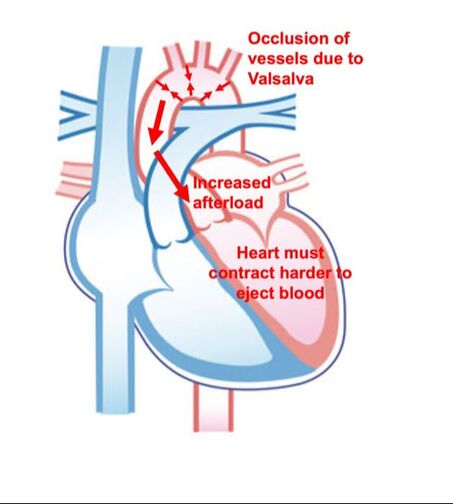 The heart adapts to the pressure stimulus by increasing the thickness of the muscular wall surrounding the left ventricle. With more muscle around the left ventricle, it gains a better ability to maintain stroke volume against a large afterload. Unlike endurance training, however, this increase in wall thickness with resistance training usually happens without a proportional increase in the left ventricle’s cavity size. Therefore, the heart’s ability to increase stroke volume with resistance training would be more due to an enhanced ability to contract the left ventricle than increased filling. 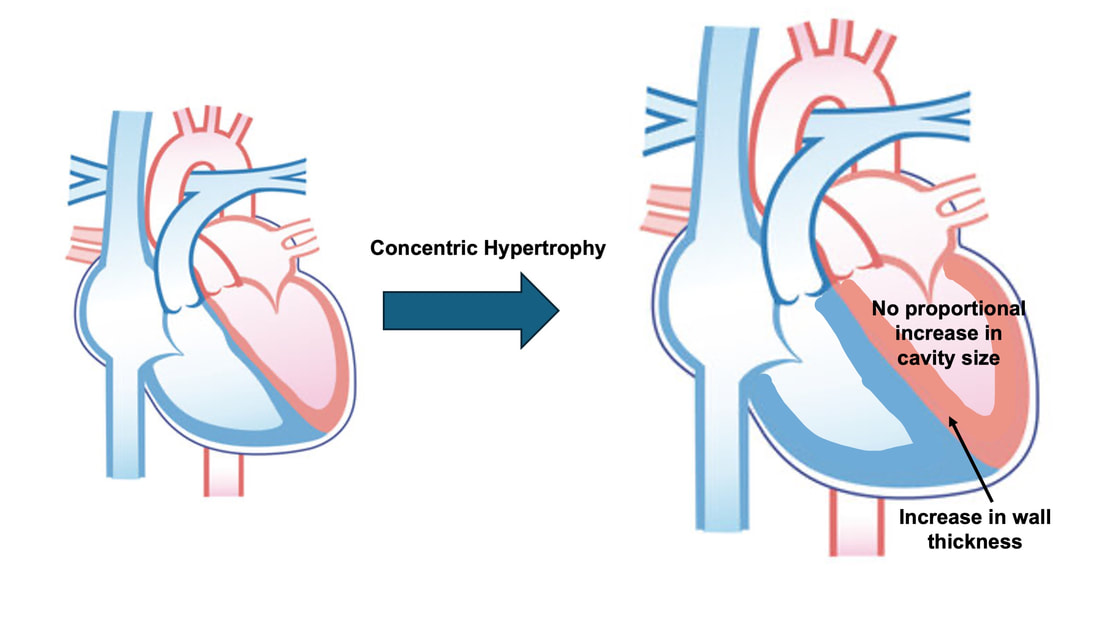 What is the functional significance?These divergent cardiac adaptations between endurance and resistance training could advantage or disadvantage the heart depending on the situation. A paper by Shave and colleagues in 2019 illustrated this paradigm nicely. They compared two groups of athletes: long distance runners and American football linemen. The runners exhibited heart dimensions consistent with eccentric hypertrophy while the linemen exhibited concentric hypertrophy. The researchers presented both groups of athletes with two challenges:
As a reminder, eccentric hypertrophy results from a volume stimulus on the heart, while concentric hypertrophy results from a pressure stimulus. With that in mind, it’s not surprising which challenge was handled better by which type of athlete. Faced with the infusion of saline, the heart would need to increase stroke volume to circulate the suddenly greater amount of blood. Both groups of athletes could do this, however, the long distance runners increased their stroke volume to a much greater extent. They could do this because their larger left ventricle cavity size is built to accommodate an increase in venous return during running. These findings are shown on the graph below, where the orange triangles on the top part of the graph represent runners (up to a 20% increase in stroke volume), whereas the purple triangles represent football linemen (up to a 10% increase in stroke volume). 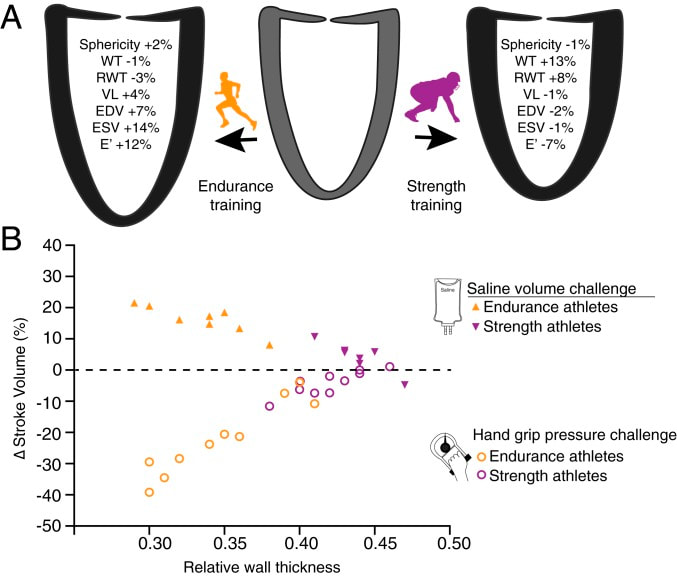 Conversely, the maximal handgrip exercise increases the afterload on the heart, which would work to decrease stroke volume. That is exactly what happened in the long distance runners, who experienced as much as a 40% drop in stroke volume, shown by the orange circles on the graph above. The purple circles, however, show that football linemen could maintain their resting stroke volume much better. Their greater wall thickness permitted them a better ability to increase contractility to overcome the elevated afterload. Eccentric or concentric remodelling of the heart…is one better than the other?The adaptations placed on the heart by endurance training and resistance training have different advantages for heart function. We could then ask the question: which adaptations are better for day-to-day life? Many would argue that eccentric hypertrophy of the heart is healthier, thus endurance training is better than resistance training. I would half agree with that. Eccentric hypertrophy is indeed healthier long-term. Concentric hypertrophy of the heart is not only observed with resistance training—it also observed with cardiovascular disease. Stiffer arteries and a higher blood pressure force the heart to contract harder to maintain a sufficient cardiac output. In this case, the resulting increase in wall thickness would be labeled “pathological concentric hypertrophy.” Multiple studies have pointed out that a higher blood pressure and arterial stiffness are sometimes observed alongside resistance training-induced concentric hypertrophy as well. The keyword above is sometimes. Resistance training could in fact produce whole-body cardiovascular adaptations that are similar to those seen with cardiovascular disease. However, that is usually only observed with high intensity resistance training. How “high intensity” am I talking about? A study by Miyachi and colleagues in 2004 subjected a group of men to whole-body resistance training at 80% of their maximum strength 3 days/week for 4 months. They observed a 30% increase in stiffness of the carotid artery following training. 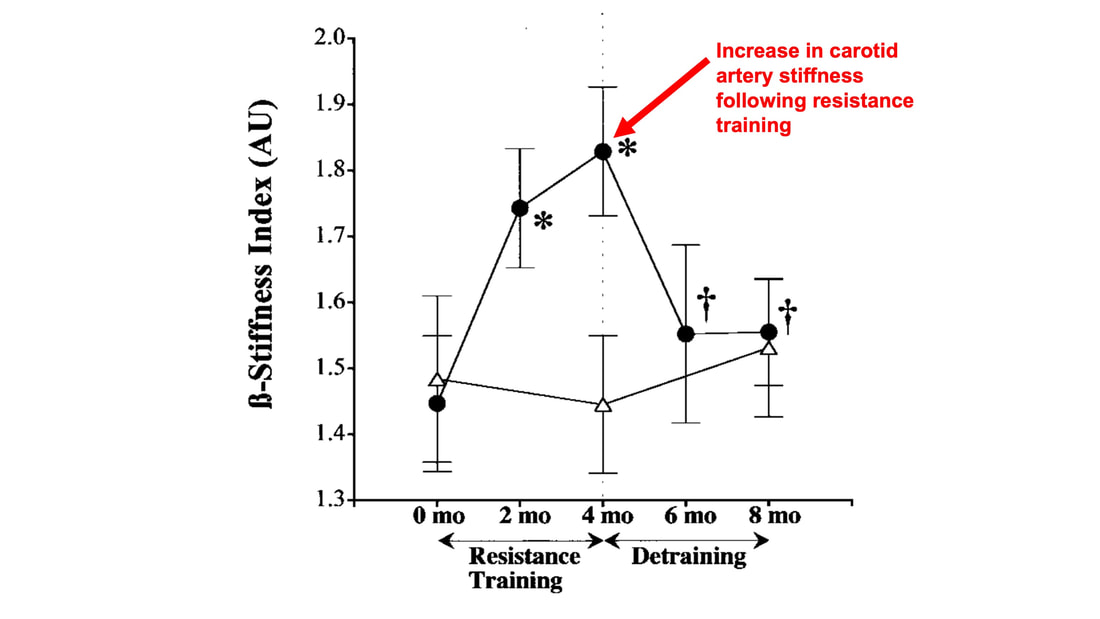 But of course they did with a training program like that! If you impose such high pressure loads on the cardiovascular system throughout the whole body so frequently, arteries will need to stiffen in order to protect themselves. Review papers by Haykowsky and colleagues (2002) and Pluim and colleagues (2000) compiled the results of multiple resistance training studies. They showed that low to moderate intensity (i.e., using weights less than 80% of maximum), balanced resistance training programs do not pose the kind of threat to the heart that the 2004 study above might frighten you with. In many cases, resistance training does not impair the heart’s diastolic function (ability to fill with blood) nor systolic function (ability to eject blood), which are both impaired alongside pathological concentric hypertrophy. Some studies have even reported remodelling of the heart closer to eccentric hypertrophy following low or moderate intensity resistance training.  The best recommendation I can give is one many have given before me: for the best results, do a bit of both. Get your resistance training in to strengthen your skeletal muscles, but maybe don’t do full-body, high-intensity resistance training 3 days/week. That alone might be enough for beneficial cardiac adaptations, but for good measure, and to better sway your heart toward eccentric hypertrophy, you should throw in some endurance training as well.
References Shave RE, Lieberman DE, Drane AL, Brown MG, Batterham AM, Worthington S, Atencia R, Feltrer Y, Neary J, Weiner RB, Wasfy MM, Baggish AL. Selection of endurance capabilities and the trade-off between pressure and volume in the evolution of the human heart. Proc Natl Acad Sci U S A. 2019 Oct 1;116(40):19905-19910. doi: 10.1073/pnas.1906902116. Epub 2019 Sep 16. PMID: 31527253; PMCID: PMC6778238. Miyachi M, Kawano H, Sugawara J, Takahashi K, Hayashi K, Yamazaki K, Tabata I, Tanaka H. Unfavorable effects of resistance training on central arterial compliance: a randomized intervention study. Circulation. 2004 Nov 2;110(18):2858-63. doi: 10.1161/01.CIR.0000146380.08401.99. Epub 2004 Oct 18. PMID: 15492301. Haykowsky MJ, Dressendorfer R, Taylor D, Mandic S, Humen D. Resistance training and cardiac hypertrophy: unravelling the training effect. Sports Med. 2002;32(13):837-49. doi: 10.2165/00007256-200232130-00003. PMID: 12392444. Pluim BM, Zwinderman AH, van der Laarse A, van der Wall EE. The athlete's heart. A meta-analysis of cardiac structure and function. Circulation. 2000 Jan 25;101(3):336-44. doi: 10.1161/01.cir.101.3.336. PMID: 10645932.
0 Comments
By Avery Hinks When we as physiologists describe how our muscles generate the force, we often refer to the smallest unit of muscle contraction, the sarcomere, and its proteins myosin and actin. A signal sent from the brain induces the release of calcium, which incites a series of events that cause actin and myosin proteins to bind, forming what we call “cross-bridges.” The formation of these cross-bridges in thousands of sarcomeres throughout a muscle produces the force that allows that muscle to lift, jump, and run.  The thing is, there’s more going on between the formation of those cross-bridges and the movement of the muscle than we often acknowledge—steps in the process that are important but easy to overlook for purposes of simplicity. Here I ask the question: how are the forces created by those cross-bridges transmitted to the bone to produce movement? First, to get oriented…To put the above question in context, it’s important to understand how a muscle is organized from its smallest to largest scale. At the smallest level, we have the individual sarcomere, containing the force-generating actin and myosin filaments as described above. Each sarcomere is about 0.0025 millimetres long. 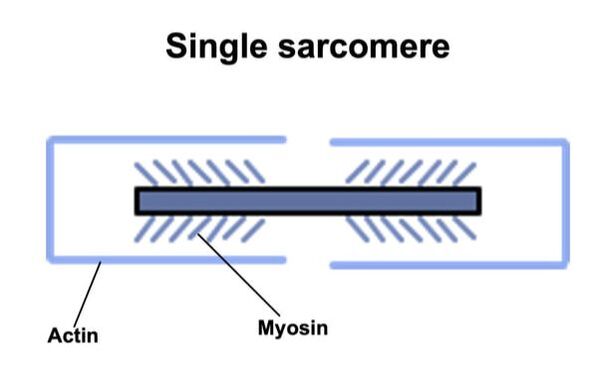 Being so small, one sarcomere can’t do much alone, so thousands of sarcomeres aligned side by side comprise what’s called a myofibril. 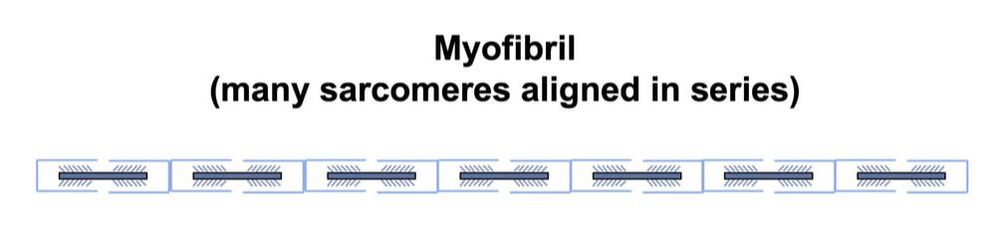 Within a muscle fibre, many of these myofibrils are packed parallel to one another. In humans, the diameter of a muscle fibre ranges from about 0.02-0.1 mm depending on how many myofibrils are packed together. So, at this scale we’re still small, but just visible to the human eye. Each muscle fibre is wrapped in a structure called the sarcolemma, which electrical signals travel down to tell the fibre to contract. The sarcolemma, in a way, separates each muscle fibre from one another. To further separate them, each muscle fibre is also surrounded by a sheath of collagen called the endomysium. 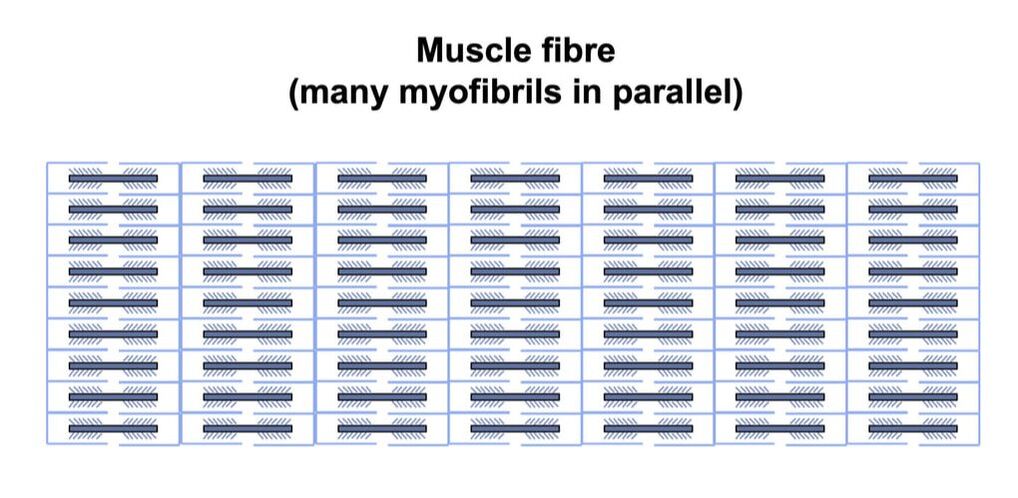 Another, larger sheath of collagen called the perimysium surrounds many muscle fibres packed together. Each distinct bundle of muscle fibres wrapped in perimysium is called a muscle fascicle. 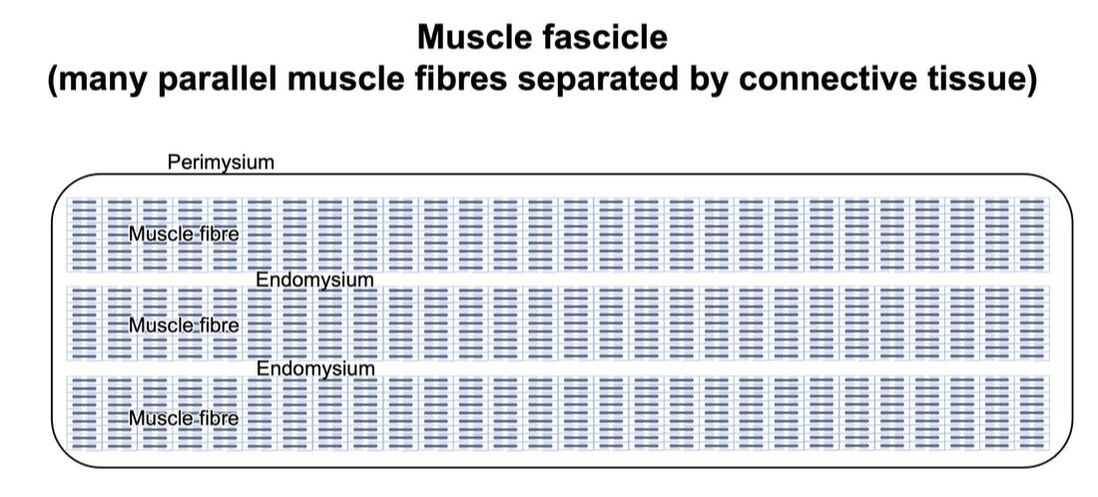 Almost there. All of these muscle fascicles packed parallel to one another comprise the whole muscle, around which there is yet another layer of collagen called the epimysium. Collectively, these sheaths of collagen (endomysium, perimysium, epimysium) comprise the extracellular matrix. 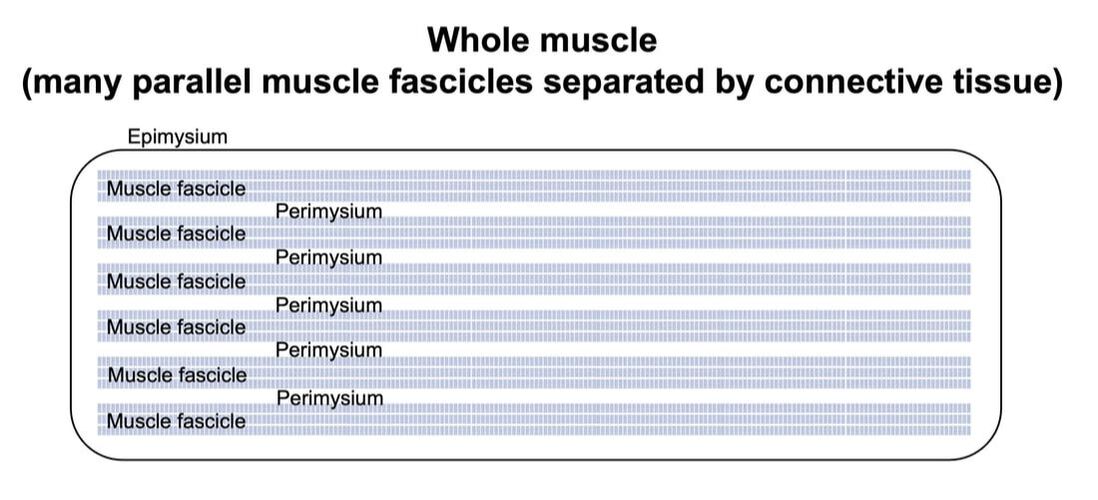 Lastly, the whole muscle needs to connect to bone, otherwise there’s no way for it to move our limbs. At each end of a muscle, the perimysium and epimysium merge into tendons, and those tendons attach directly to bones. 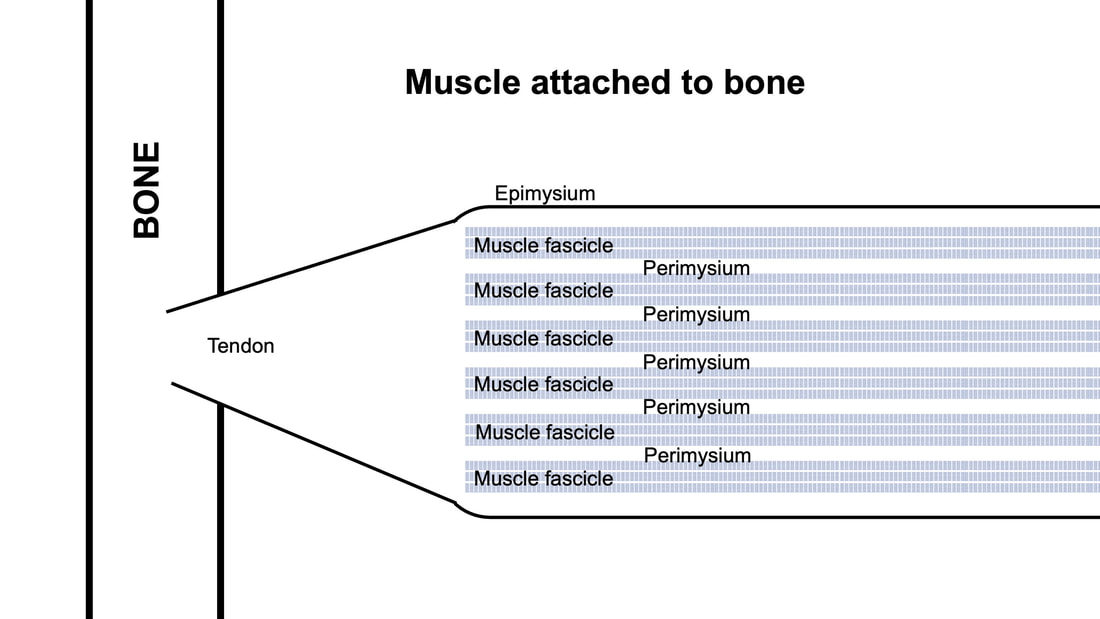 You might’ve picked up on the problem here…if it’s the extracellular matrix that connects to bone, how the heck are the sarcomeres supposed to move bone? Wouldn’t that mean the muscle fibres just contract inside each of their own collagen sheaths without accomplishing anything? What connects sarcomeres to the extracellular matrix?Dispersed along the sarcolemma of each muscle fibre, there are large clusters of proteins called costameres. There are two types of costameres: the dystrophin-glycoprotein complex and the integrin complex. 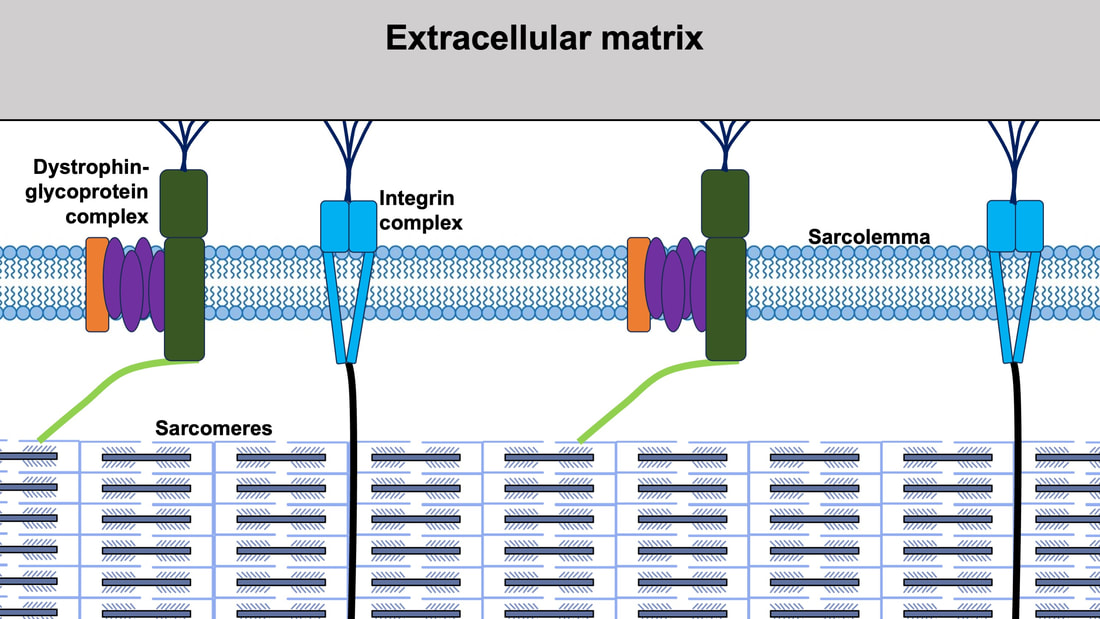 Other proteins extend off either end of these costameres to anchor them to both the sarcomere and the extracellular matrix. On the extracellular matrix side, this anchoring is done mostly by a protein called laminin. On the sarcomere side, there are several proteins we could focus on, but for the purposes of this article, I’ll focus on two: dystrophin and desmin. Laminin, dystrophin, desmin, and the proteins that makeup costameres are all classified as intermediate filaments. 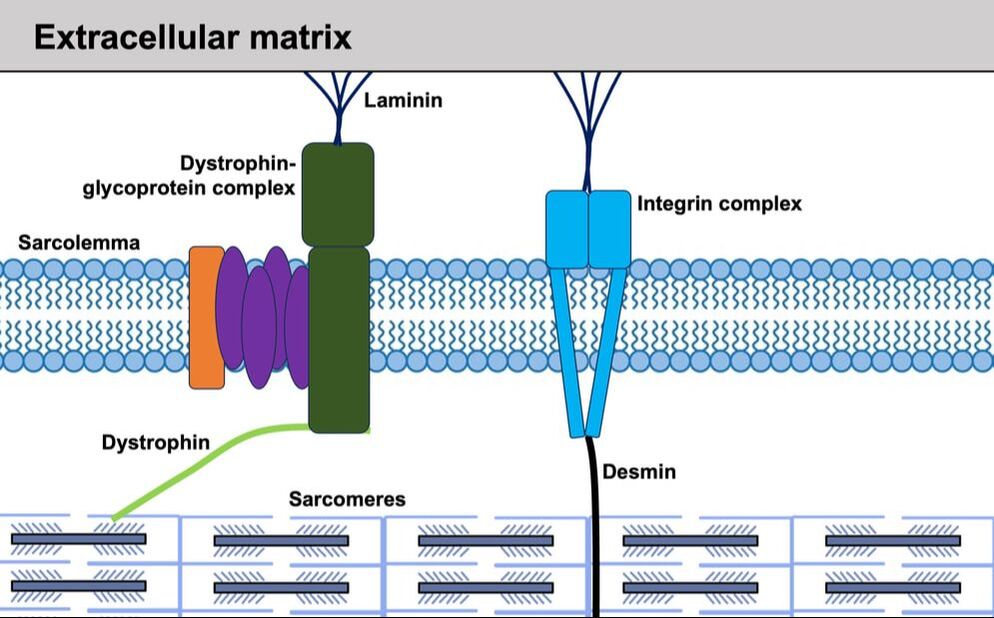 So, how is a sarcomere’s force transferred to the extracellular matrix? As the sarcomere contracts, it pulls on the intermediate filaments, then the intermediate filaments pull the extracellular matrix. As a result, force is transferred all the way from the sarcomere to the tendon then bone. 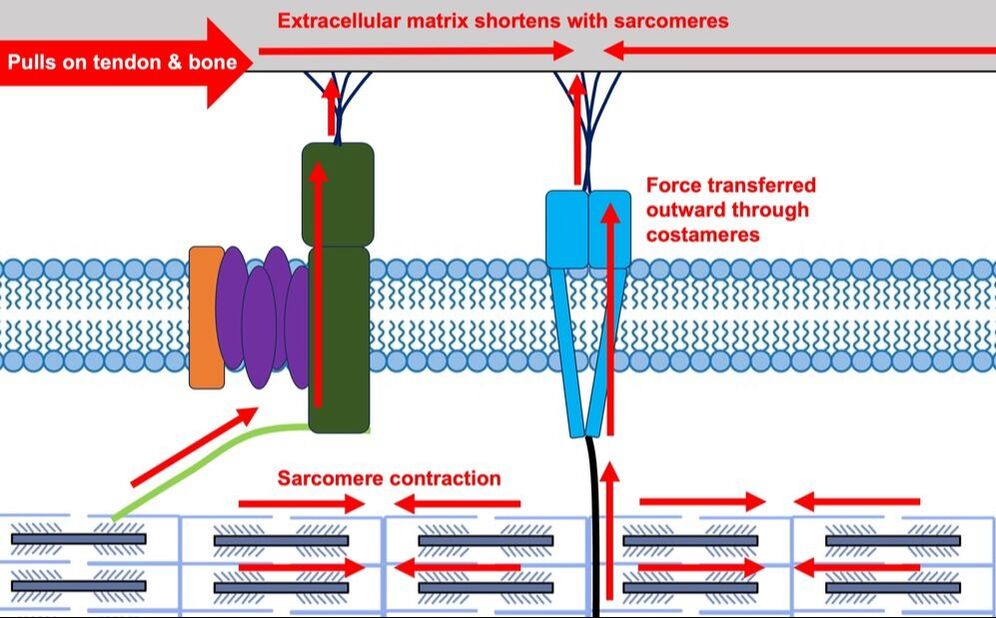 Intermediate filaments also help coordinate movement between each muscle fibre. To understand what I mean by that, picture this like draft horses pulling weights at a fair. As you can see in the picture below, not only are the draft horses connected to the weights they’re pulling, they’re also connected to each other. Imagine the chaos that might ensue if one horse started moving faster than the other, or if they accidentally veered in opposite directions. That link (the intermediate filaments) between the horses (muscle fibres) keeps them moving in the same direction and speed as they drag those weights (bones).
What if we didn’t have these intermediate filaments?Researchers have used mice lacking dystrophin (called “mdx mice”) to understand dystrophin’s importance for stabilizing muscle contractions. An impressive example came from Godfrey and colleagues at Oxford. They assessed muscle strength in mdx mice and the susceptibility to muscle damage during exercise. More importantly, they reintroduced dystrophin to mdx mice at varying levels of dosage to investigate whether that would improve their muscle function. As shown in the graphs below, mdx mice that did not receive any dystrophin treatment were the weakest (left graph) and the quickest to experience muscle damage during exercise (right graph). Unsurprisingly, introducing more and more dystrophin into their muscles progressively increased their strength and made them less susceptible to damage. 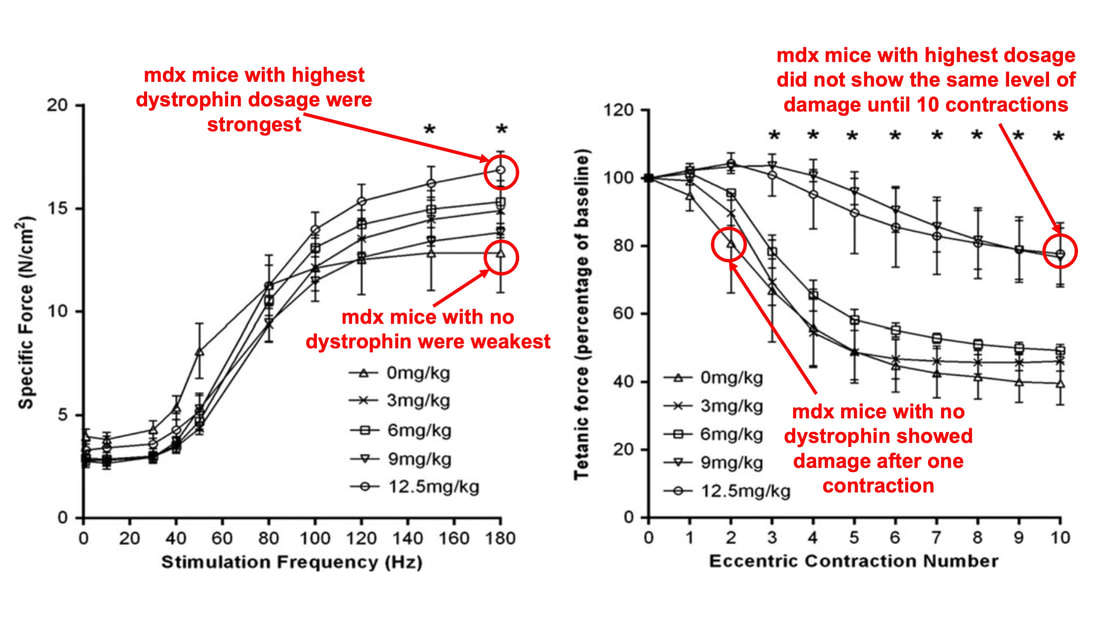 From Godfrey et al. (2015), showing that the loss of dystrophin reduces muscle strength and increases susceptibility to muscle damage, and readministering dystrophin reverses those changes. When considering dystrophin’s role as described earlier, these results make sense. Dystrophin anchors the sarcomere’s actin filaments to the sarcolemma. Without dystrophin, there is less coordination between fibres, making some fibres more likely to be too compressed or stretched to produce maximal force. Additionally, the sarcolemma is left unstable, making it more likely to breakdown during intense exercise. 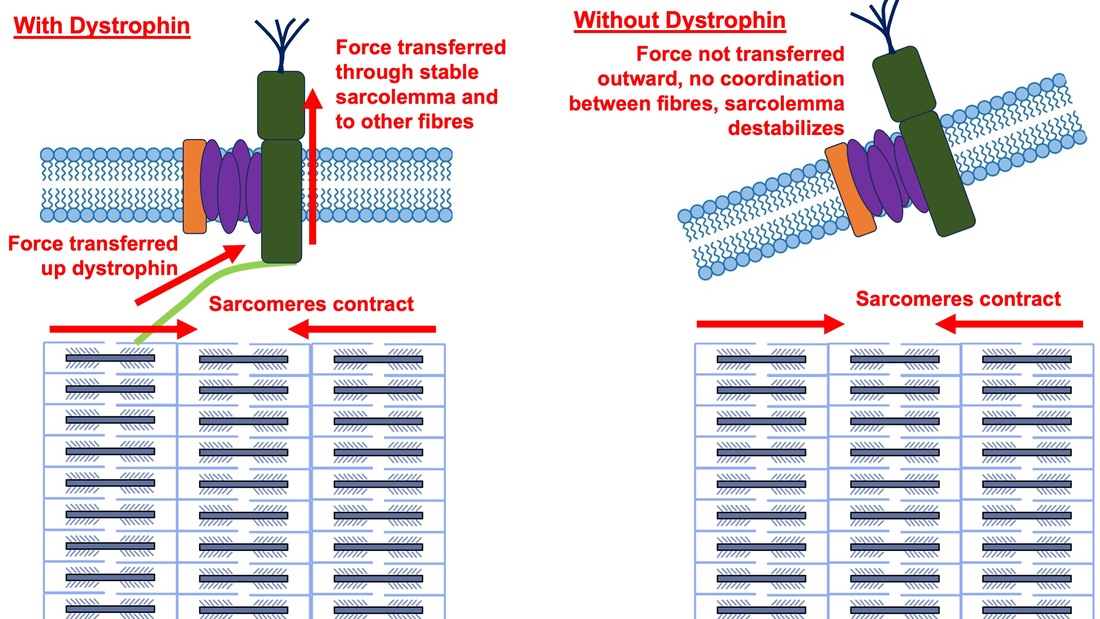 Desmin also anchors the sarcomere to the sarcolemma, so it would be reasonable to expect a lack of desmin to induce effects similar to a lack of dystrophin…except it’s not quite the same. Sam and colleagues from the University of California performed an experiment similar to the dystrophin study described above, only using desmin-null mice (mice with a mutation causing them to not express desmin in their muscles). Like in mice lacking dystrophin, the researchers observed a 12% reduction in strength in desmin-null mice (left graph below). When exposing the muscles to intense exercise, however, the demisn-null mice actually experienced less damage than regular mice (right graph below). 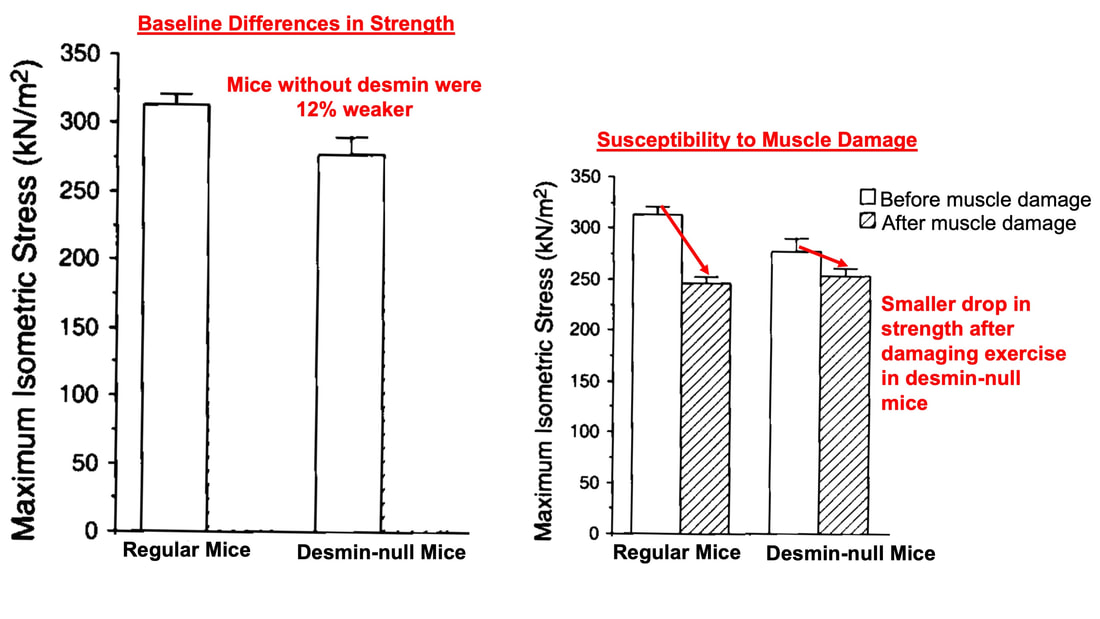 From Sam et al. (2000), showing that loss of desmin results in loss of muscle strength but less susceptibility to muscle damage. The loss of strength without desmin is the same as the argument for dystrophin: force isn’t as easily transferred between fibres, hindering the muscle’s ability to coordinate force production. Regarding damage, however, it seems that desmin’s different attachment points compared to dystrophin create an opposite effect. Desmin instead wraps around the Z-disks (i.e., the ends) of a sarcomere and connects to the integrin complex. Researchers have speculated that, without that connection between integrin and the Z-disks, the extracellular matrix bears more of the load during damaging exercise. As a result, the muscle fibres themselves are left less perturbed. 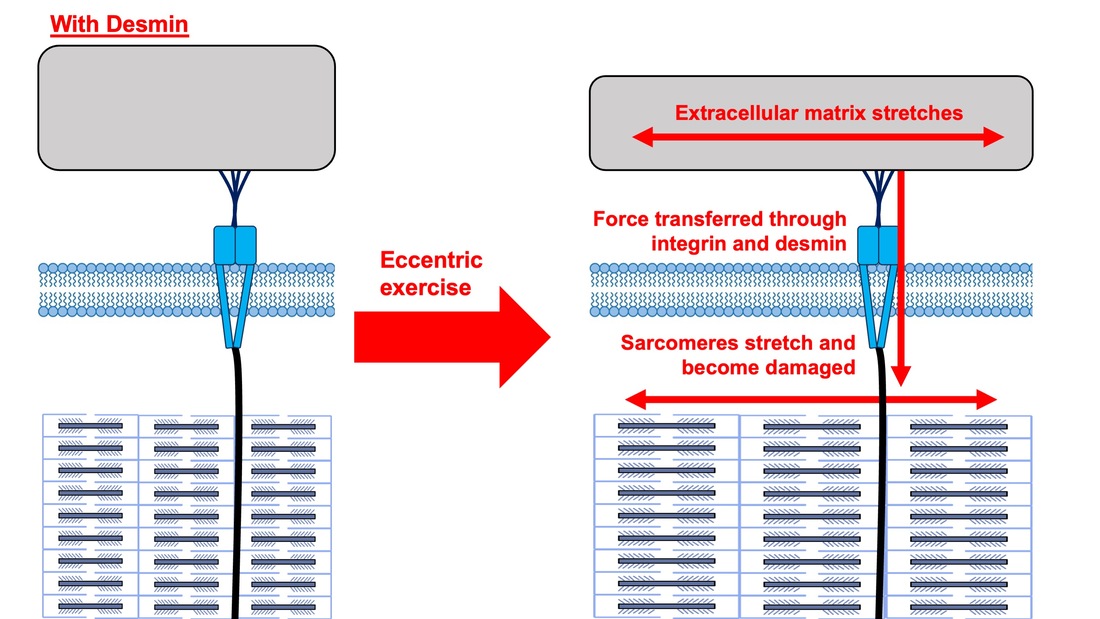 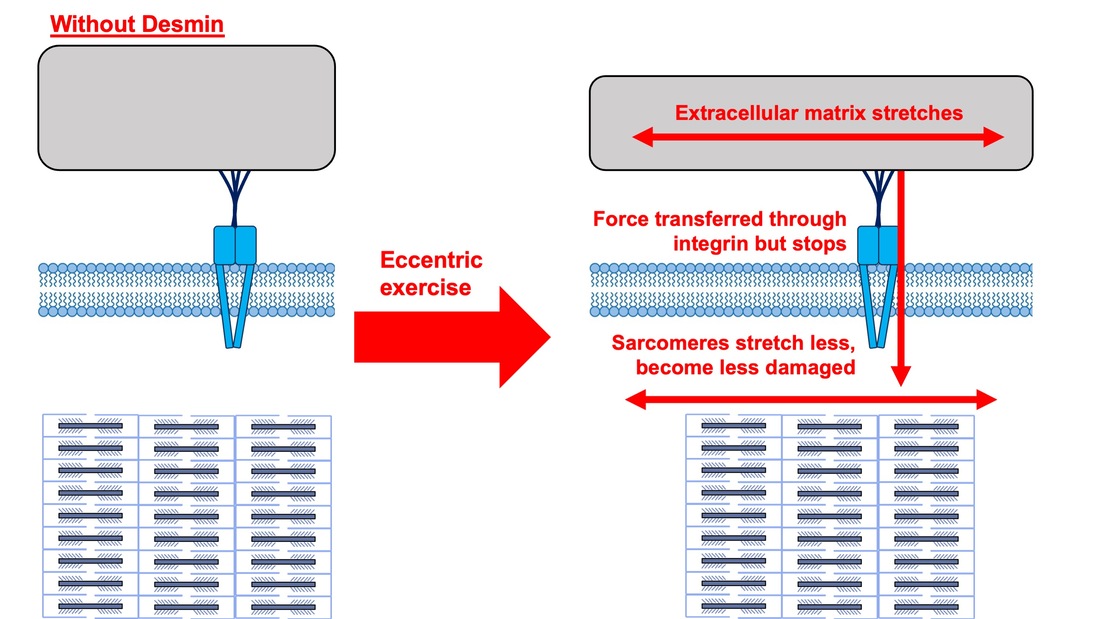 This might seem like a benefit of desmin mutation, but an inability to damage muscle during exercise comes with disadvantages too. In order for a muscle to grow stronger following exercise, it needs to undergo some level of stress. If a lack of desmin prevents that from happening, the muscle is less likely to adapt to exercise. These studies are from genetically modified rodents. Why do we care?Do we, as humans, have to worry about the integrity of our intermediate filaments in the real world? While rare, there are in fact diseases that affect intermediate filaments. Duchenne’s muscular dystrophy affects 1 in 3500 males and causes muscle to lack dystrophin. Some people also experience desminopathy, which involves a mutation on desmin that makes it defective. Of greater concern, however, is that muscles lose dystrophin with age. Researchers at the University of Michigan showed that, like mdx mice, aged rats exhibit an impairment in the ability to transmit force between muscle fibres. That inability to transmit force was associated with a smaller density of dystrophin. So (surprise, surprise), loss of dystrophin is one of the many contributors to the loss of strength with age. 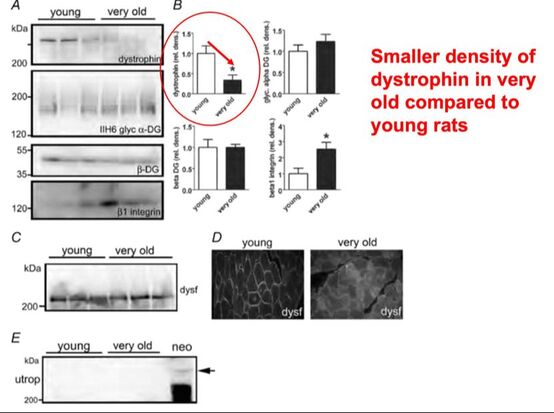 From Ramaswamy et al. (2011), showing that muscles lose dystrophin with age. Conclusion When discussing muscle contraction, focus is often placed on the sarcomere. While the sarcomere is of course important, its ability to translate force to bone and create movements would not be possible without the intermediate filaments that anchor it to the sarcolemma and extracellular matrix. Without intermediate filaments, like draft horses with no reins binding them together, chaos ensues.
References Godfrey C, Muses S, McClorey G, Wells KE, Coursindel T, Terry RL, Betts C, Hammond S, O'Donovan L, Hildyard J, El Andaloussi S, Gait MJ, Wood MJ, Wells DJ. How much dystrophin is enough: the physiological consequences of different levels of dystrophin in the mdx mouse. Hum Mol Genet. 2015 Aug 1;24(15):4225-37. doi: 10.1093/hmg/ddv155. Epub 2015 May 1. PMID: 25935000; PMCID: PMC4492390. Ramaswamy KS, Palmer ML, van der Meulen JH, Renoux A, Kostrominova TY, Michele DE, Faulkner JA. Lateral transmission of force is impaired in skeletal muscles of dystrophic mice and very old rats. J Physiol. 2011 Mar 1;589(Pt 5):1195-208. doi: 10.1113/jphysiol.2010.201921. Epub 2011 Jan 10. PMID: 21224224; PMCID: PMC3060596. Sam M, Shah S, Fridén J, Milner DJ, Capetanaki Y, Lieber RL. Desmin knockout muscles generate lower stress and are less vulnerable to injury compared with wild-type muscles. Am J Physiol Cell Physiol. 2000 Oct;279(4):C1116-22. doi: 10.1152/ajpcell.2000.279.4.C1116. PMID: 11003592. The loss of motor units with age is an inevitable process: What is it and how do we measure it?1/23/2024 By Avery Hinks In my previous knowledge translation articles, I’ve given extensive attention to the loss of muscle mass and strength with age. I’ve talked less, however, about how that loss comes about. When discussing those losses in muscle mass and function, one can arguably point to one aspect of the neuromuscular system: the motor unit. What is a motor unit? Any conscious muscle action—whether we’re lifting a cup of coffee, kicking a soccer ball, or doing a backflip—begins with an electrical signal from the brain. That signal will travel from the brain down the spinal cord to something called an alpha motor neuron. Each alpha motor neuron connects through a nerve to a particular set of muscle fibres within a muscle. The signal will pass through the alpha motor neuron, down the nerve, then cause the muscle fibres associated with that motor neuron to contract. An alpha motor neuron together with the muscle fibres it controls is called a motor unit, and this is the smallest anatomical unit under voluntary control. There are hundreds of motor units in many muscles of the human body! 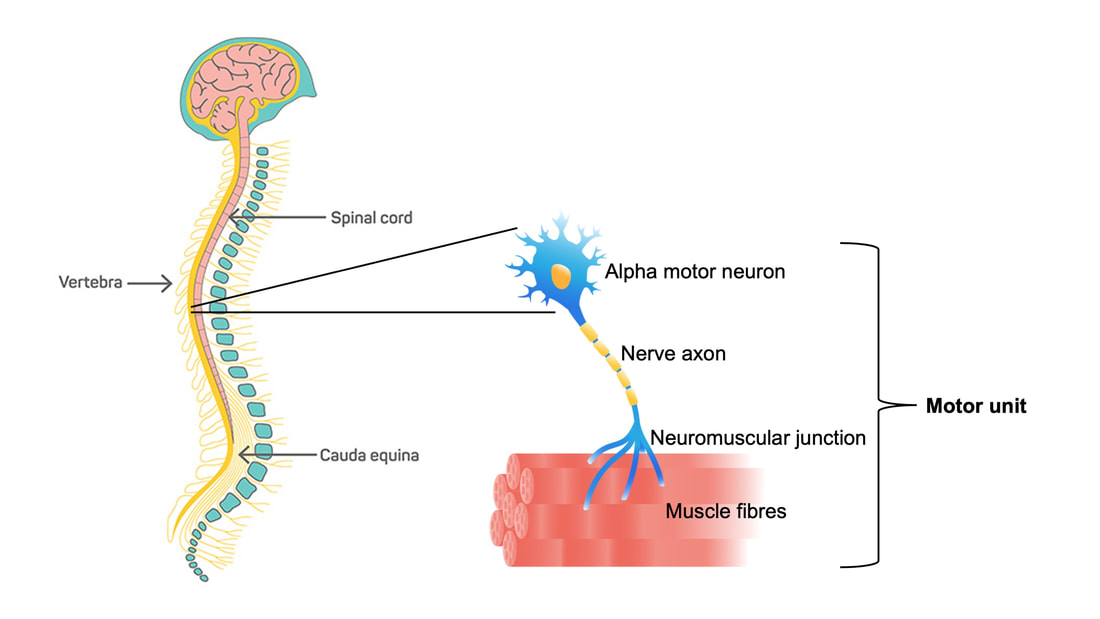 The number and type of motor units recruited depends on the action being performed. Lighter, more finely controlled tasks like lifting a coffee cup require motor units that activate “slow twitch” muscle fibres, which produce a small amount of force and contract slowly. These motor units require a lower electrical signal from the brain to activate, labeled as “low threshold.” Lifting something heavier—say you’re helping a friend move their desk—will require motor units that activate “fast twitch” muscle fibres, which produce more force and contract fast. These motor units are “high threshold,” activated when a stronger electrical signal is sent from the brain. Regardless of the task, motor units will be recruited in order of lowest threshold to highest threshold. What happens to motor units throughout the lifespan?Throughout adulthood, motor units go through cycles of denervation and reinnervation. Essentially, the connection between an alpha motor neuron and its muscle fibres is severed then rebuilt anew, again and again. When that process is healthy, it looks something like the figure below. Note that the fibres are reinnervated by the same alpha motor neuron that originally innervated them. 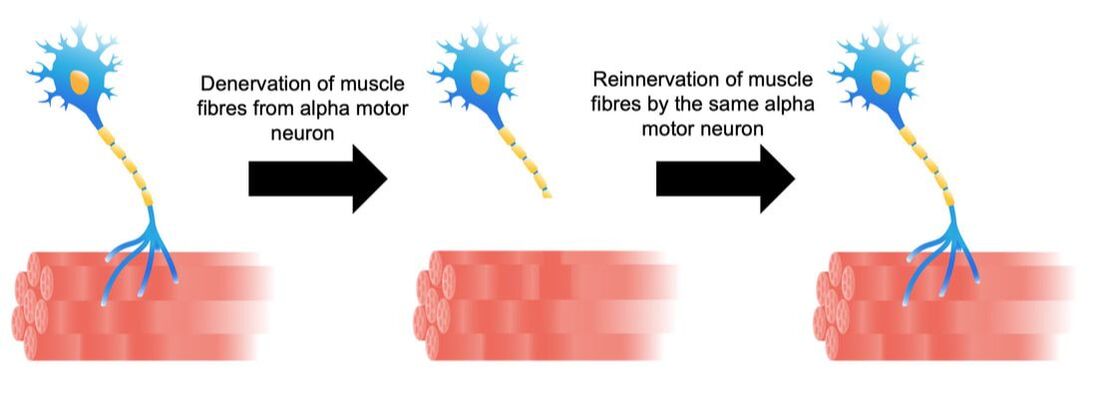 As aging progresses, this process changes form. Sometimes, the alpha motor neuron dies, and its muscle fibres are instead added to that of a neighbouring motor unit. These fibres then take on the fibre type of their new alpha motor neuron. For example, if the fibres were previously fast twitch, but became innervated by a low-threshold motor neuron, they would transition to slow twitch. Sometimes, however, that doesn’t even happen. Sometimes those leftover muscle fibres are not reinnervated by anything, and wither away. 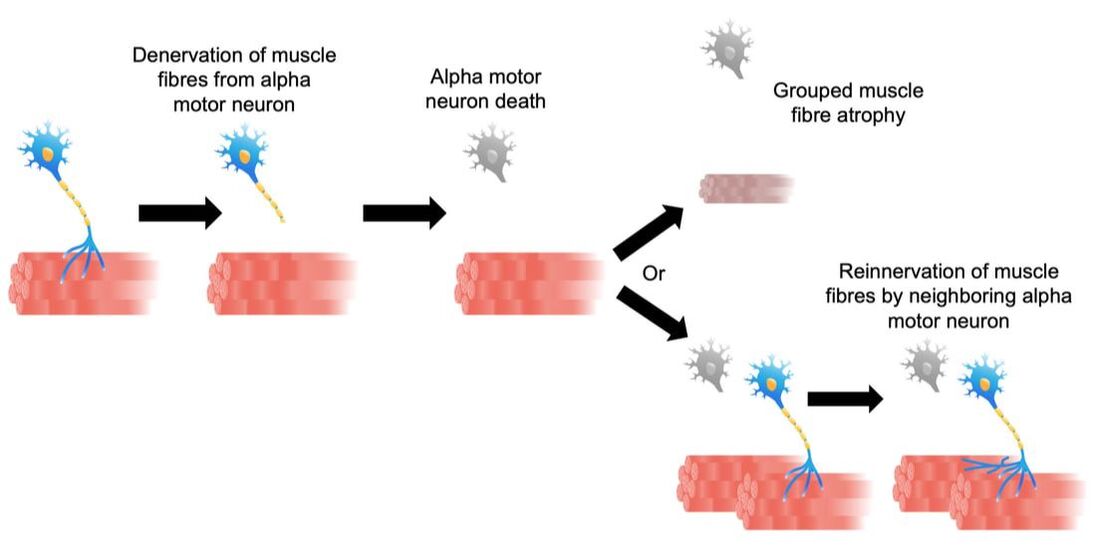 How is motor unit loss measured?A motor unit’s activity manifests as an electrical signal called an action potential. Researchers can detect action potentials using a technique called EMG, which involves placing electrodes over the muscle of interest. These can be surface electrodes, which are like stickers and pick up activity of many motor units at once, or needle electrodes, which are inserted through the skin to pick up activity of a single motor unit. To estimate total motor unit number, researchers need two values:
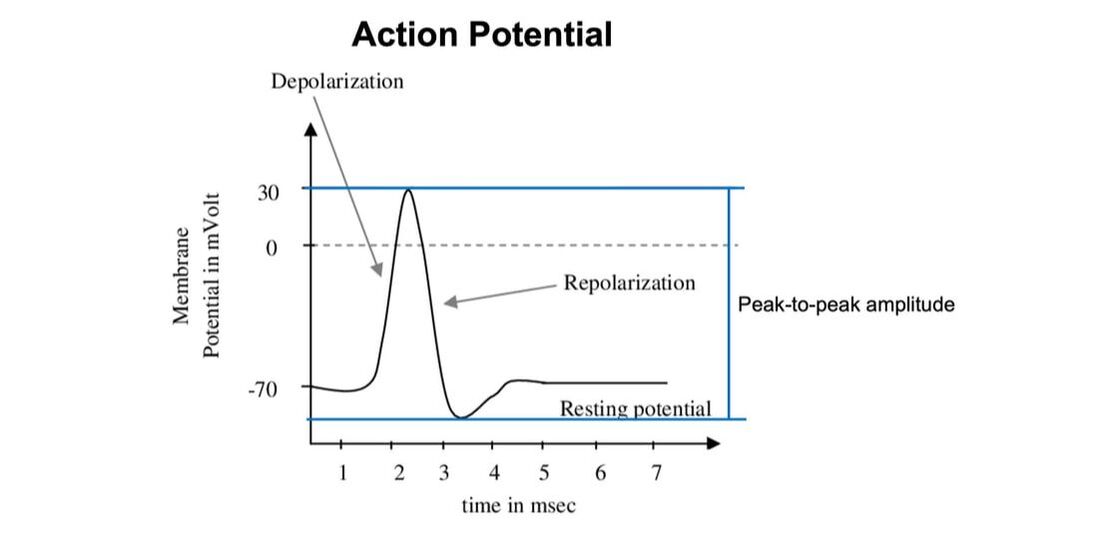 The first is obtained using needle electrodes to record from various individual motor units. The second can be recorded using surface EMG, and is obtained by maximally stimulating the muscle’s nerve to activate all motor units. Once you have both, you divide the action potential amplitude of the total motor unit pool by that of the average single motor unit—then voila, you have an estimated motor unit number! 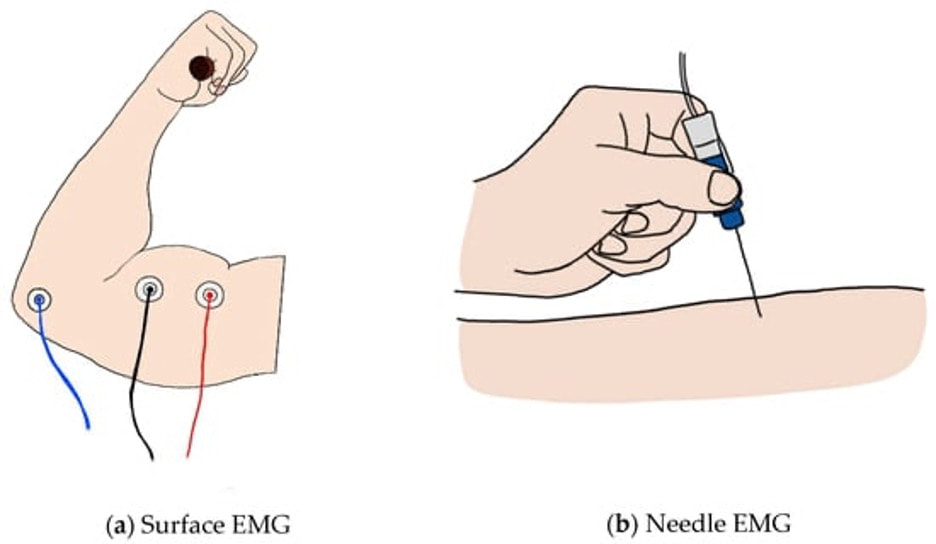 From: https://encyclopedia.pub/entry/7298 A 2005 study by McNeil and colleagues from the University of Western Ontario compared motor unit number in the tibialis anterior muscle (the muscle along your shin, pictured below) between three age groups: 25 years, 65 years, and 80 years old. From 25 to 65 years, they detected a 40% decrease in the number of motor units. That number decreased a further 33% when going from 65 to 80 years. 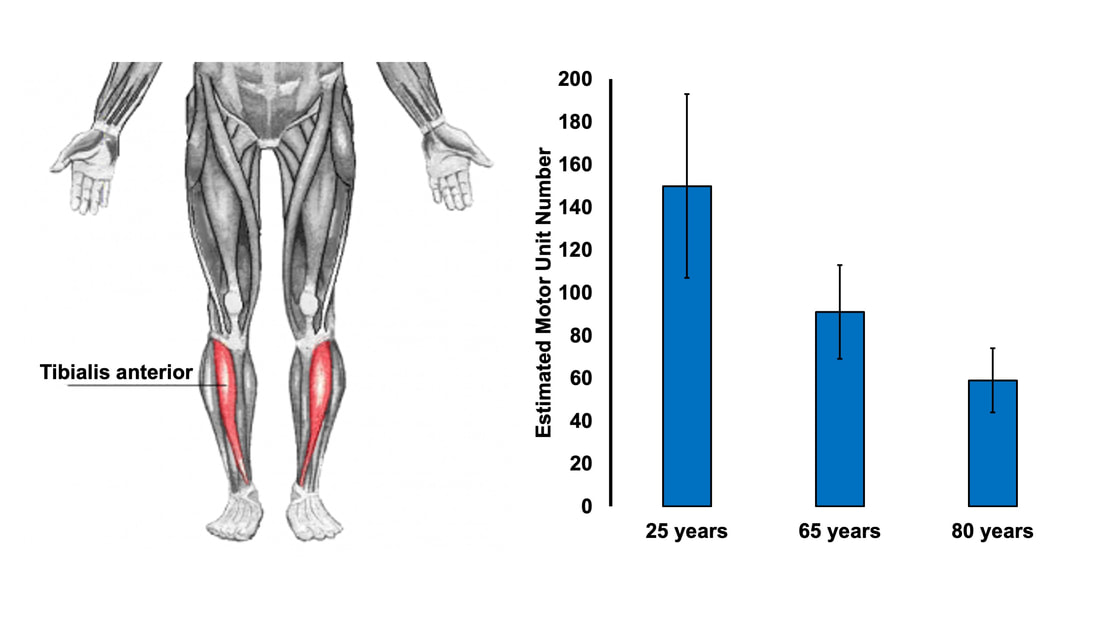 Why do we lose motor units with age and what happens with the remaining muscle fibres?Motor neurons die due to a combination of factors. Put simply, we experience damage and modifications to our DNA throughout life. Eventually, the accumulation of those DNA stresses causes cells to die, including motor neurons. This isn’t all doom and gloom, though—researchers have noted impressive ways in which the body compensates for motor unit loss. Despite observing a 40% reduction in motor unit number from ~25 to 65 years of age, the study above did not observe any differences in maximum muscle strength between those two age groups. How can this be? The easiest answer may be that the remaining motor neurons are sufficiently reinnervating the muscle fibres that get left behind. In that case, we could get a decrease in the number of motor units without a loss in the number of muscle fibres. In other words, the number of muscle fibres within a motor unit increases while the total number of motor units declines. 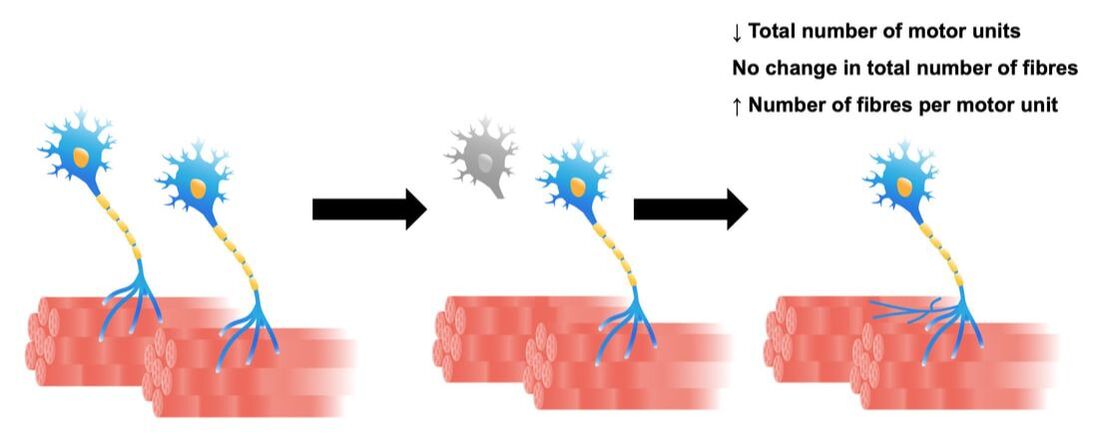 This phenomenon would preserve strength, but could still have disadvantages. With a smaller number of motor units, there would be a less gradual recruitment of muscle fibres. Instead of steady recruitment that allows for fine-tuned, smooth movements, the recruitment becomes more like a staircase, producing jerkier movements. This staircase-shaped muscle fibre recruitment is one reason you might find your movements become less stable as you age. 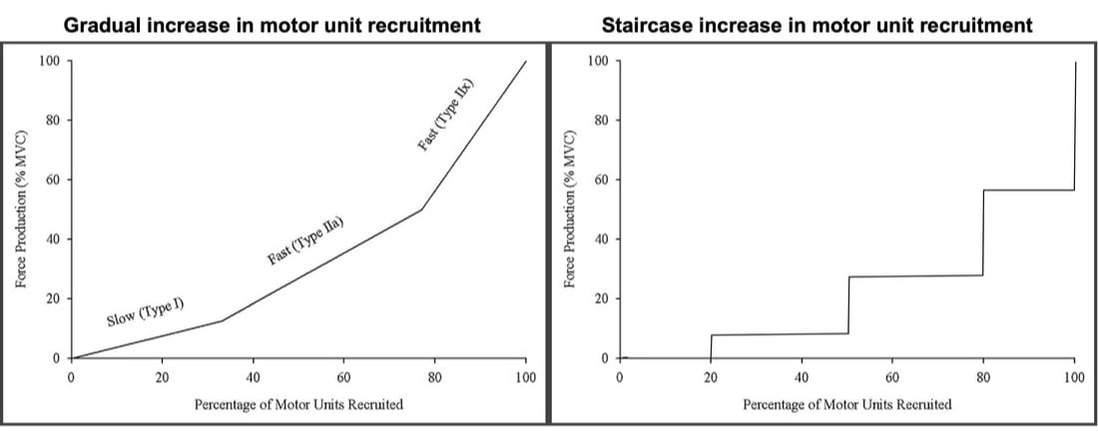 Figure on the left is from: https://pubmed.ncbi.nlm.nih.gov/15794706/. The figure on the right was not created from any data and is purely for visual comparison. But I also mentioned earlier that not all fibres are reinnervated after their motor neuron dies. Can the body compensate for that? It turns out, yes! The fibres that aren’t lost with alpha motor neuron death retain a remarkable ability to compensate for those that are lost. A study in 2008 by Frontera and colleagues tracked a group of older men for twelve years—from about age 70 to 80. They obtained measurements of strength and size in the quadricep muscles of these men, and (via muscle biopsies) in the muscle fibres that comprise those muscles. As expected, these men experienced a 6% decrease in quadricep muscle size, and 22-37% decreases in quadricep muscle strength after 12 years. 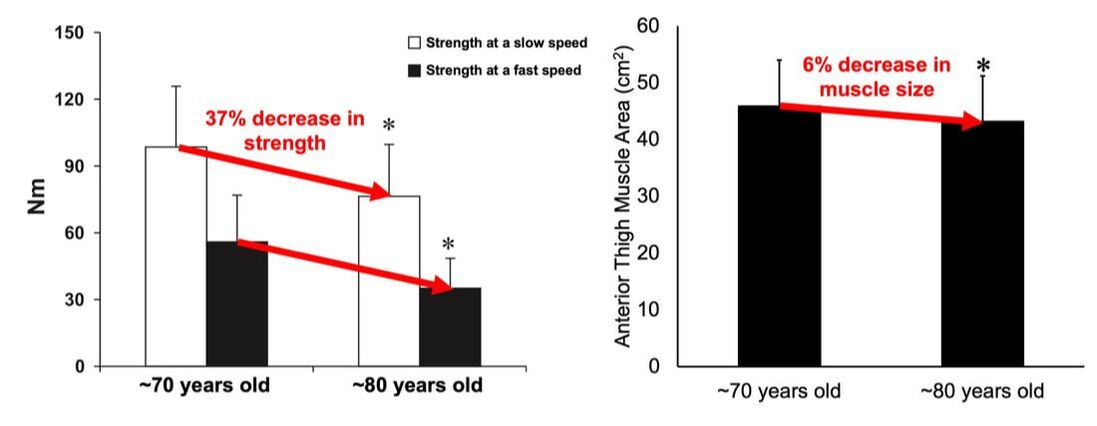 The single muscle fibres, remarkably, did not show the same trend. They saw no significant differences in fibre size or force across the 12 years. Some fibres on average even trended toward being larger and stronger. In other words, the remaining muscle fibres really try to pick up the slack of those that are lost with age. 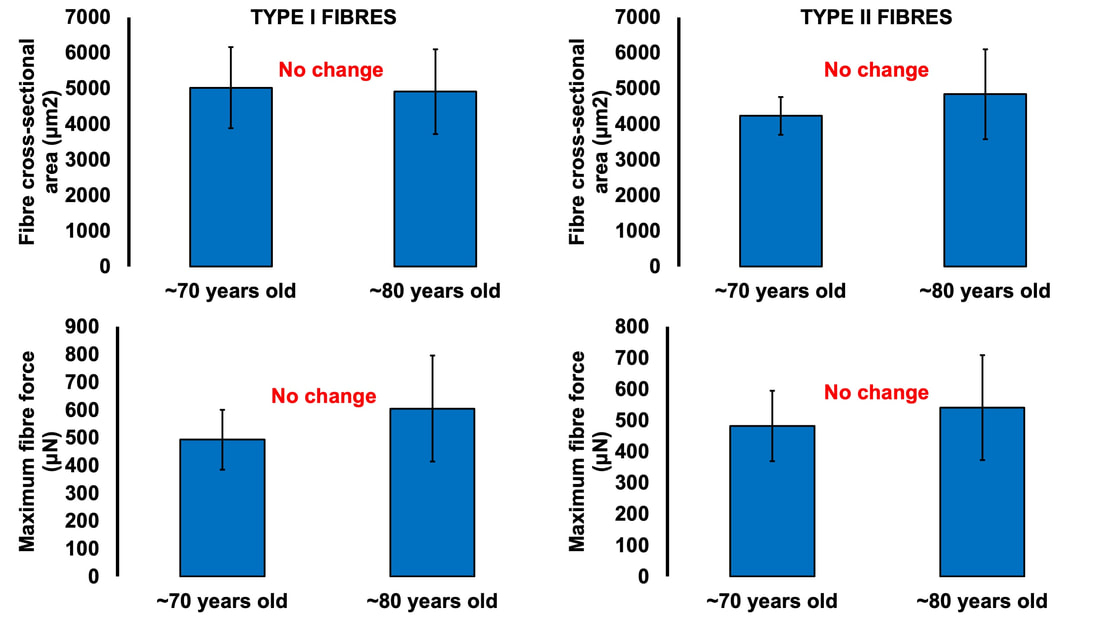 ConclusionOverall, picture motor unit loss with age using the following (a bit weird, but bear with me) analogy: You and your friend are each trying to carry an armload of rocks from Point A to Point B. Halfway there, your friend trips and drops all their rocks, and they can’t get back up. You try to compensate for this by picking up all your friend’s rocks, too. You’re able to fit most of their rocks in your arms along with your own, but don’t have quite enough space and leave some behind. You and your friend are motor neurons, the rocks are muscle fibres, and going from Point A to Point B is aging. While you may retain about the same number of muscle fibres as you age, you have fewer motor neurons working to carry them.  AUTHOR’S NOTE: I’m currently studying for my PhD candidacy exam. That leaves me with less writing time, so of course I had to turn my studying into an outlet to still write these knowledge translation articles. I figure they can help both myself and you (the reader) learn from the topics I’m studying. With that, this is the first of four knowledge translations (one for each section of my exam) that I’ll be writing over the next few months. Hopefully they’re interesting!
References McNeil CJ, Doherty TJ, Stashuk DW, Rice CL. Motor unit number estimates in the tibialis anterior muscle of young, old, and very old men. Muscle Nerve. 2005 Apr;31(4):461-7. doi: 10.1002/mus.20276. PMID: 15685623. Frontera WR, Reid KF, Phillips EM, Krivickas LS, Hughes VA, Roubenoff R, Fielding RA. Muscle fiber size and function in elderly humans: a longitudinal study. J Appl Physiol (1985). 2008 Aug;105(2):637-42. doi: 10.1152/japplphysiol.90332.2008. Epub 2008 Jun 12. PMID: 18556434; PMCID: PMC2519941. By Avery Hinks Around age 40 or 50, women experience a reduction in ovarian hormones leading to the cessation of menstruation—an event termed “menopause.” This event is not only associated with changes in the ovaries, however. The hormonal changes correspond to changes in various systems throughout the body including the cardiovascular system, central nervous system, musculoskeletal system, and more. In humans, muscle strength progressively declines into old age. This decline becomes more drastic in women than men at around the age of 50. Researchers have understandably pointed to menopause as a contributor to this sex difference in the age-related decline of strength. However, our understanding of what goes on in muscle during menopause is limited.  Studies on mice have looked at the above question more closely by using an ovariectomized model. In these mice, either one or both of the ovaries are surgically removed, leaving them with no ovarian hormones. These mice allow researchers to then assess how muscle function changes in the absence of ovarian hormones compared to mice in which the ovaries were left intact. The ovariectomized model has a few shortcomings, however. Most importantly, ovariectomized mice have ovarian hormones one day, then suddenly don’t the next day. That is not how menopause works. A transitional period called “perimenopause” precedes actual menopause, marked by a gradual reduction in ovarian hormones. In humans, this gradual reduction occurs on average over 3-4 years, but can sometimes last up to a decade. The ovaries also retain the ability to produce testosterone during perimenopause, which would be missed by the ovariectomy model’s complete removal of the ovaries. A more recent model employing the occupational chemical 4-vinylcyclohexene diepoxide (thankfully shortened to just “VCD”) aims to better mimic the gradual reduction in ovarian hormones that occurs during natural menopause. This model allows for investigation of how muscle function changes both leading up to and following the onset of menopause. Our lab has so far published two studies using the VCD model. Here’s what we’ve found so far… The influence of a mouse model of perimenopause on muscle fibre functionOur lab’s recent paper by Mashouri and colleagues induced gradual ovarian failure in mice by VCD injection. We then assessed muscle fibre function 120 days after the injections, which corresponds to the onset of menopause. These assessments involve dissecting out a single fibre from a mouse muscle then tying it to a system that can control its length and activation (pictured below). Altogether, we could investigate how perimenopause impacts performance at one of the smallest levels of muscle contraction. 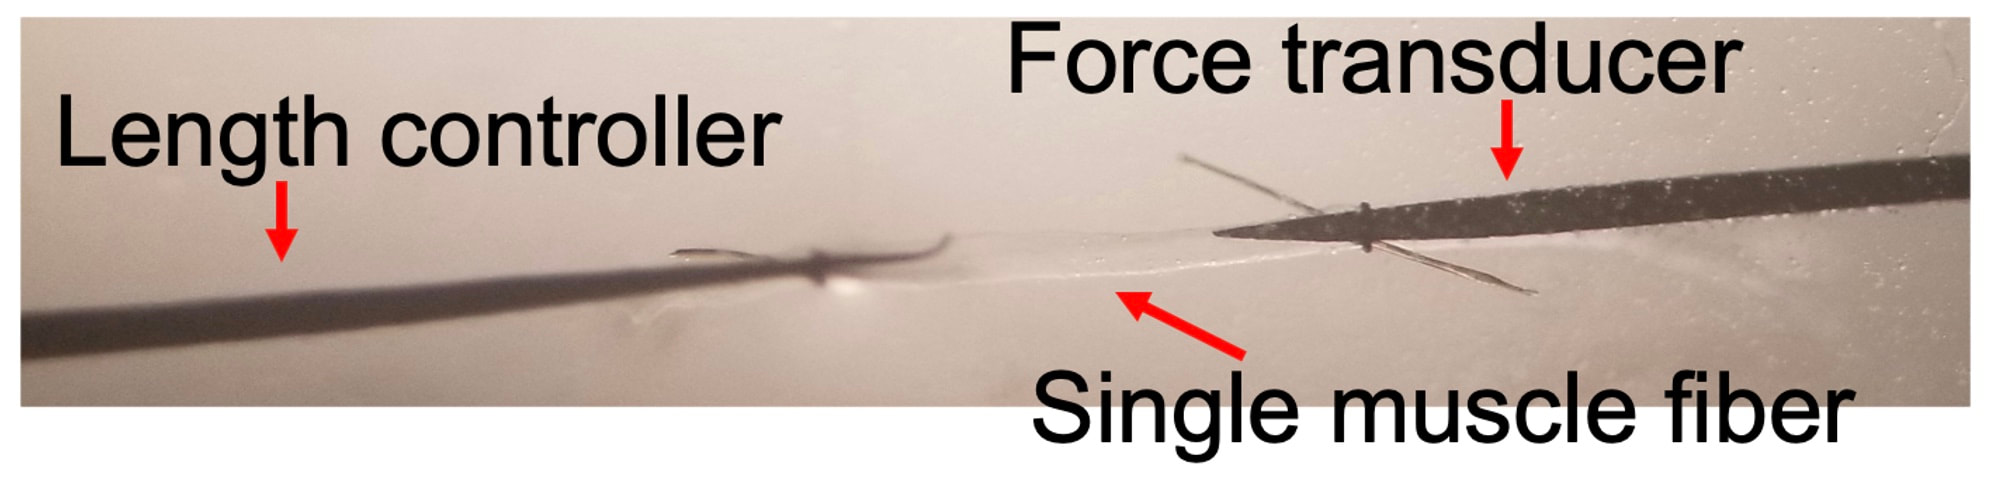 In this study, we investigated four main measures of muscle fibre function:
The graph below shows differences in absolute force between control and VCD mice. The muscles assessed were the extensor digitorum longus (EDL) and soleus (SOL), which are located on the shin and are responsible for pointing the toes. Surprisingly, at the onset of menopause, VCD mice had greater soleus single fibre force than controls! You might be thinking this goes against what we would expect with menopause. It certainly does, however, looking deeper provided clarity. 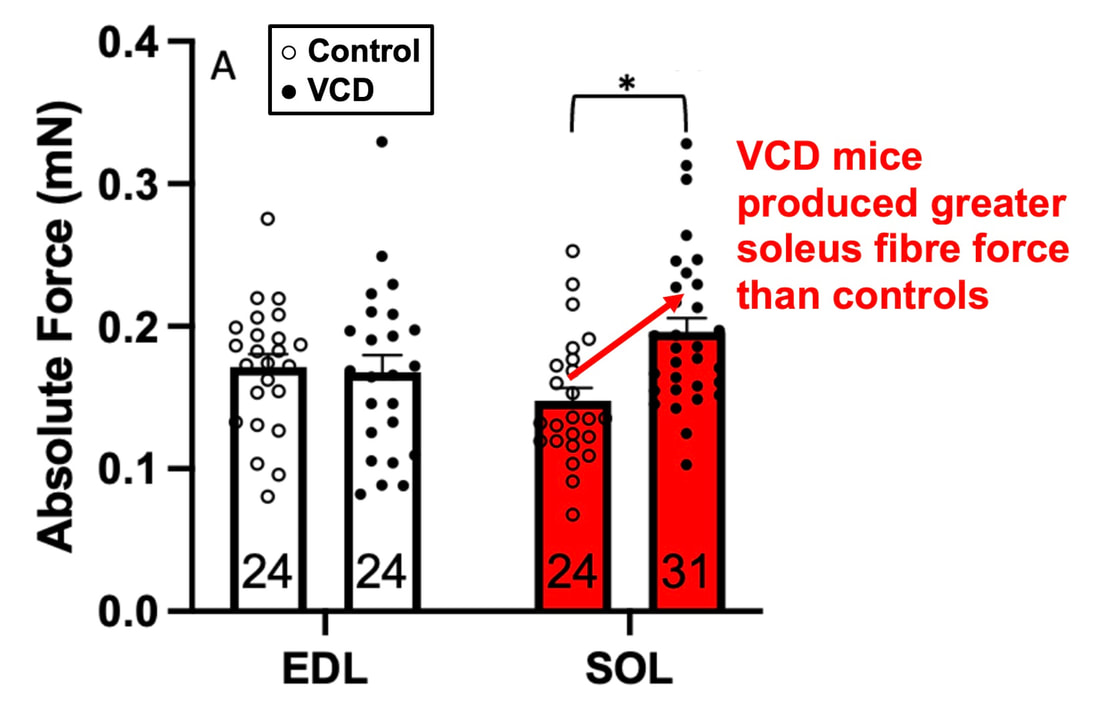 Like with absolute force, we saw that soleus fibre cross-sectional area (“CSA” in the graph below) was also greater in VCD than control mice. Furthermore, normalizing absolute force to cross-sectional area (“specific force” in the graph below) eliminated the difference in force between control and VCD mice. These findings tell us that the greater force in VCD soleus fibres was largely due to a greater fibre cross-sectional area. 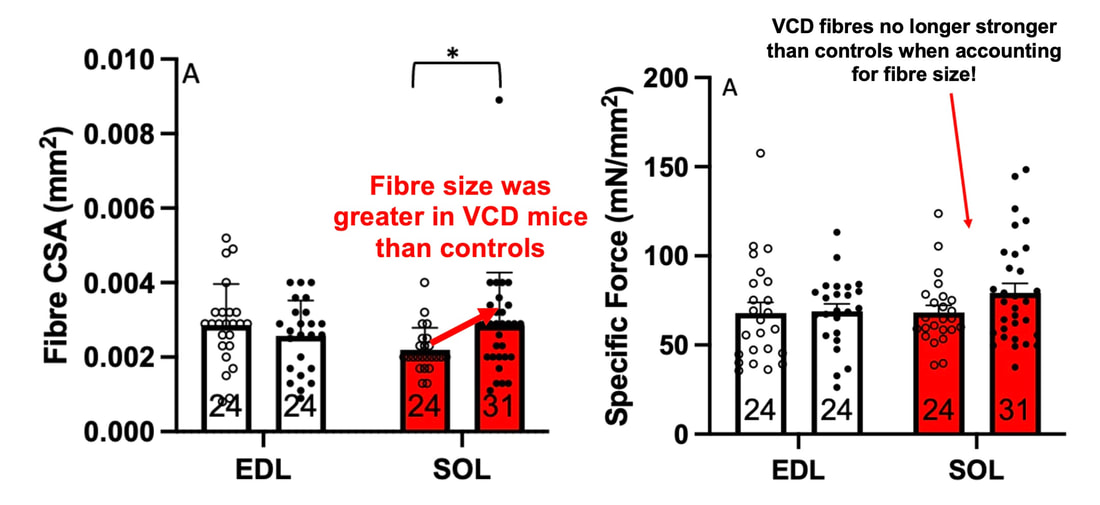 We also found that soleus fibres of VCD mice could develop force faster than controls. These, again, must seem like the exact opposite of what we would expect with menopause. 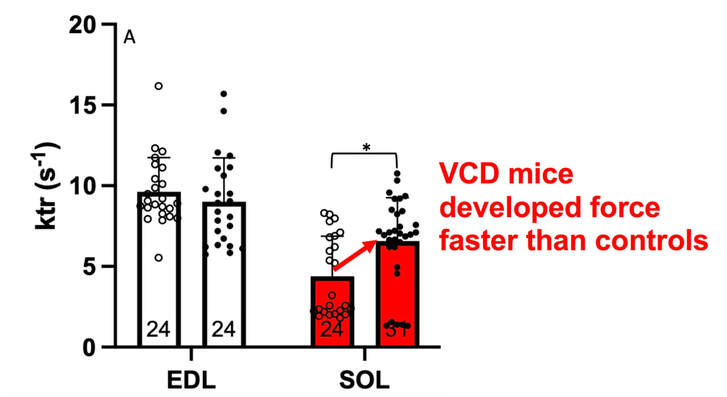 We must consider from these data that the single fibres are being tested alone, and do not necessarily represent how the muscle would function as a whole. In particular, muscle fibres come in two types: type I and type II. Type I muscle fibres are smaller, slower, and weaker. Type II muscle fibres, conversely, are larger, faster, and stronger. Therefore, perhaps these findings are indicative of VCD mice having more type II muscle fibres… And that is precisely what we found. As shown in the graph below, the soleus muscle of VCD mice had a larger proportion of type II fibres than controls! 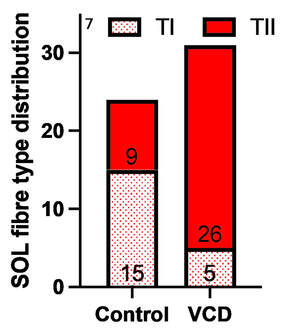 So, what does all this tell us? During perimenopause, gradual ovarian failure may cause a shift toward a greater proportion of type II muscle fibres in the soleus. This shift manifests as greater strength, size, and rate of force development within individual muscle fibres. We speculated that this shift may represent a compensatory adaptation in preparation for the declines in function that are about to occur with menopause. As well, type II fibres are more fatigable than type I fibres. Therefore, this fibre type shift could have a negative impact on muscle function in the form of greater fatigability. While this study provided important insight into how muscle function changes during perimenopause, two questions remained unanswered. First, this study only investigated the onset of menopause, leaving findings on what happens during menopause unanswered. Second, this study only investigated static measures of muscle fibre performance. The effect of ovarian failure on muscle function during movement was therefore unknown. Our next study addressed both of these questions. The influence of VCD-induced ovarian failure on muscle fibre dynamic contractile functionA study from our lab by Hubbard and colleagues used the same model as the study above. This time, however, mice were assessed 176 days after VCD injections. The onset of ovarian failure occurs at 120 days in these mice, therefore, 176 days (8 weeks later) is viewed as “late menopause.” This study also introduced high intensity interval training as a factor. High intensity interval training (“HITT” for short) involves brief but intense bursts of exercise separated by brief rests. For these mice, the type of HITT exercise was uphill running, and proceeded in the order shown below. 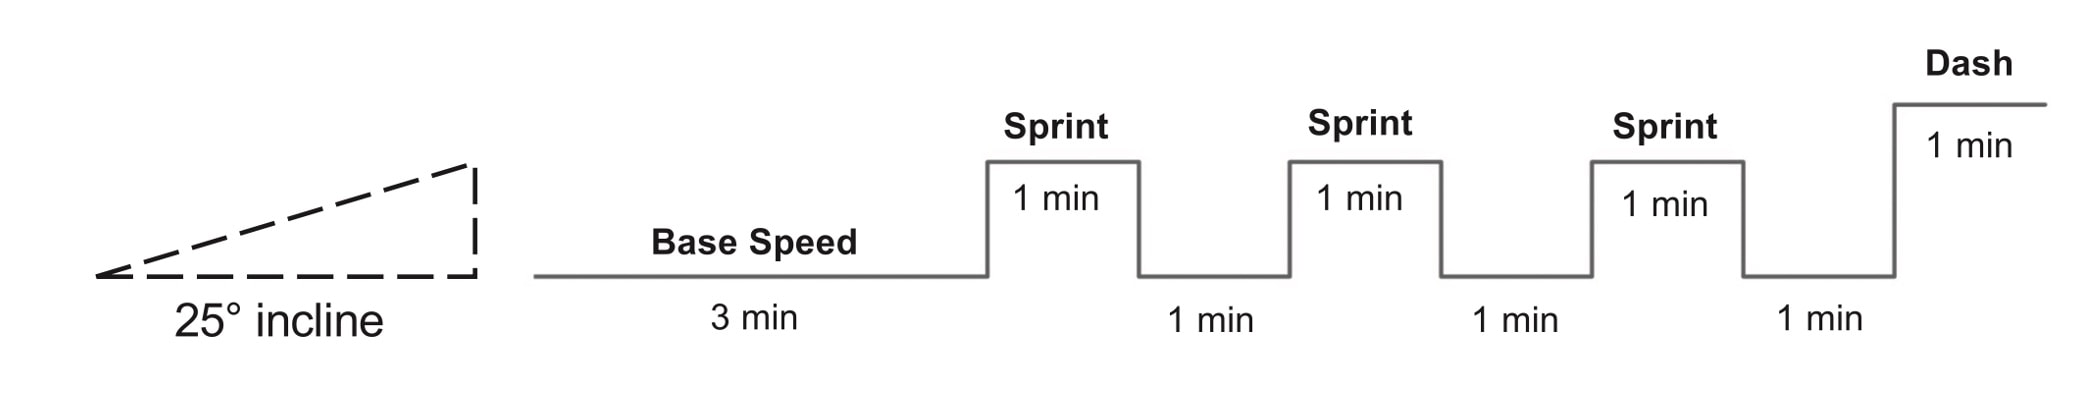 A group of mice began training 3 days/week 120 days after VCD injections. In other words, we wanted to see if training starting at the onset of menopause could mitigate any impairments in muscle function observed in late menopause. This time, in addition to assessing the muscle fibres’ maximum strength, we also assessed maximum speed (known as “maximum shortening velocity”). However, a muscle’s force and velocity are inversely related—meaning that as a muscle shortens faster, the possible force it can produce decreases. We can combine force and speed together by assessing a muscle fibre’s maximum power, which is equal to force multiplied by velocity. 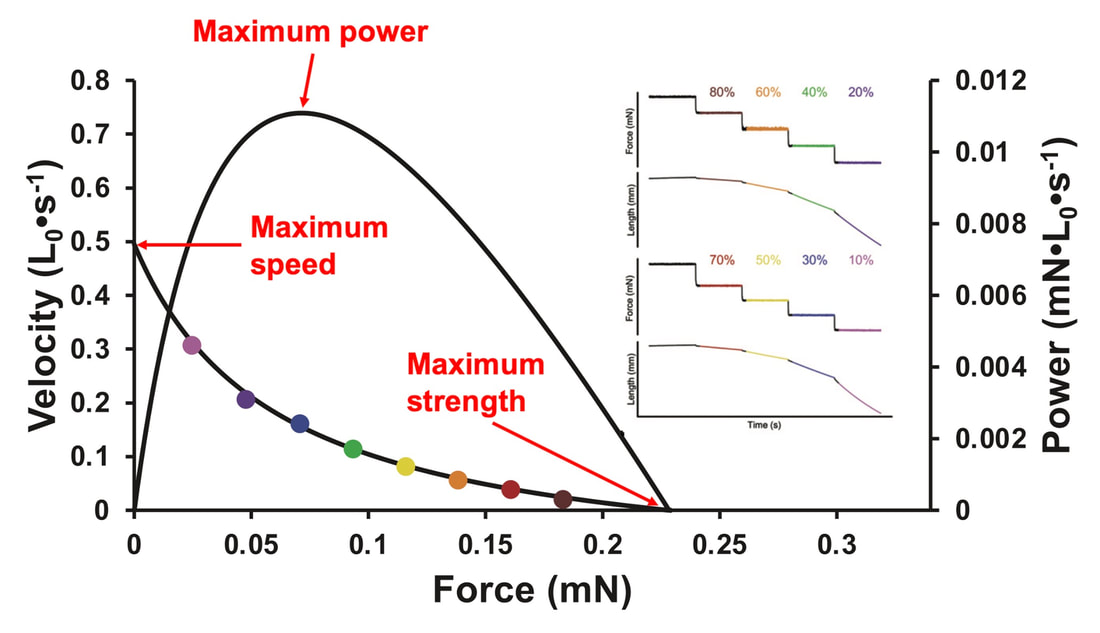 In the graph above, you’ll see that maximum power occurs when both force and velocity are not maximal. This trade-off between force and velocity makes power the gold standard for assessing a muscle’s function during movement. Power is the kind of measure you'd use to assess someone's performance in jumping as high as they can.  Hubbard and colleagues saw that late into menopause, muscle fibres were 30% deficient in strength (“Po” in the graph below). This reduction in strength coincided with similar reductions in muscle fibre size (“CSA” in the graph below). Notably, these results are different from what Mashouri and colleagues observed at the onset of menopause. Therefore, the progression of menopause, but not necessarily the phase of perimenopause leading up to it, is characterized by a reduced capacity for muscle fibres to generate strength. 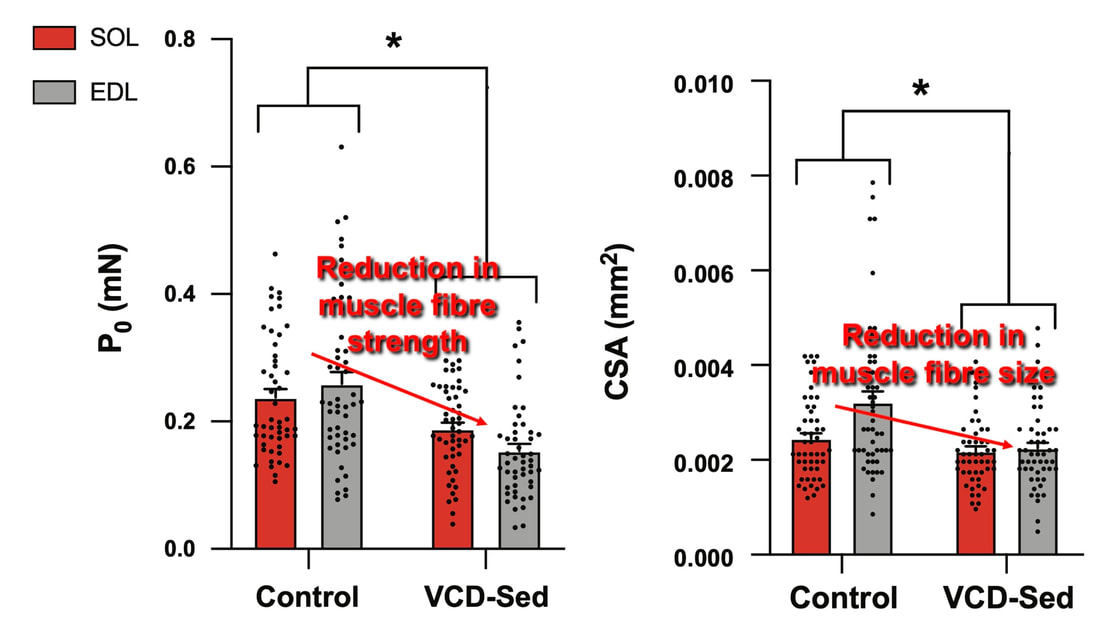 Interestingly, we saw no difference in the maximum shortening velocity of muscle fibres (Vmax in the graph below) between control and sedentary VCD mice. However, we still observed a 30% reduction in the fibres’ maximum power. Combined with the findings above, we can gather that a reduction in dynamic performance with menopause stems from a reduction in muscle fibre strength but not speed. 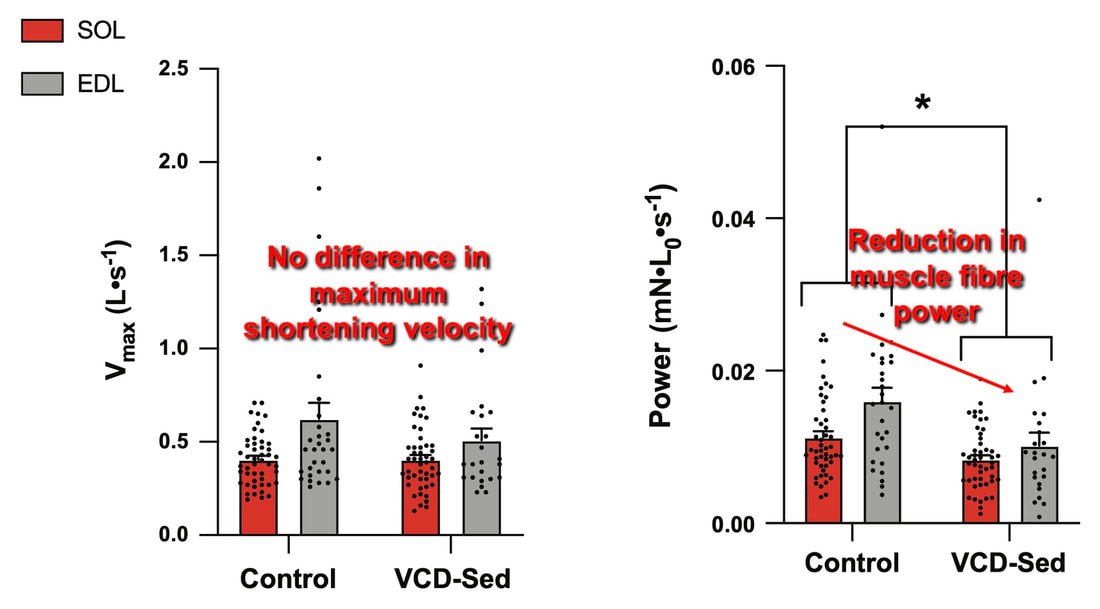 But the big question is: did high intensity interval training mitigate the loss of strength and power? The graphs below show a comparison between control mice, sedentary VCD mice (VCD-Sed) and trained VCD mice (VCD-Train) for strength (Po), maximum shortening velocity, and maximum power. Training maintained the strength of VCD muscle fibres up to the values of control mice (shown on the left below). The effect of training on maximum power was not quite as strong, however, training still increased power by 20% compared to untrained VCD mice (shown on the right below). As mentioned above, power encompasses both force and velocity. Therefore, the smaller effect of training on power seems to be due to training having no beneficial effect on maximum shortening velocity (shown in the middle below). 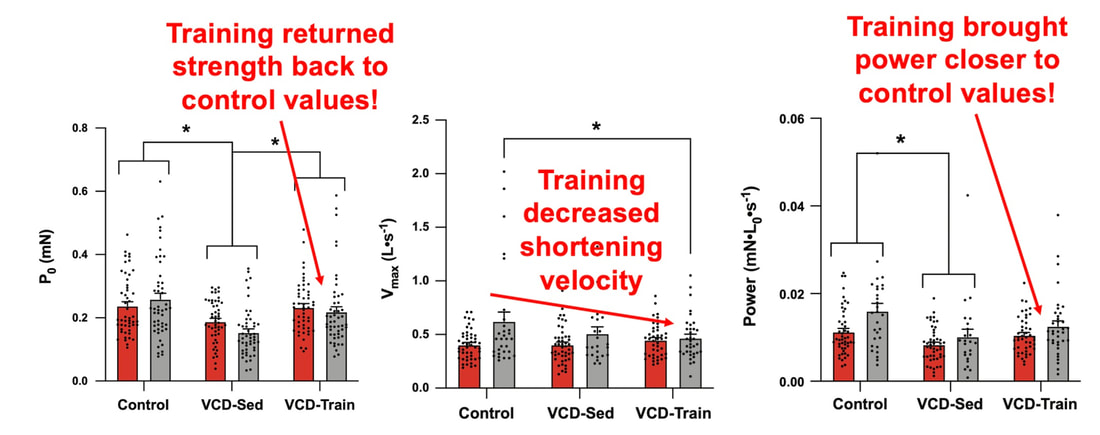 Additionally, muscle fibres of trained VCD mice had a greater cross-sectional area than untrained VCD mice. This maintenance of fibre size with training likely accounted for some of the maintenance of strength. 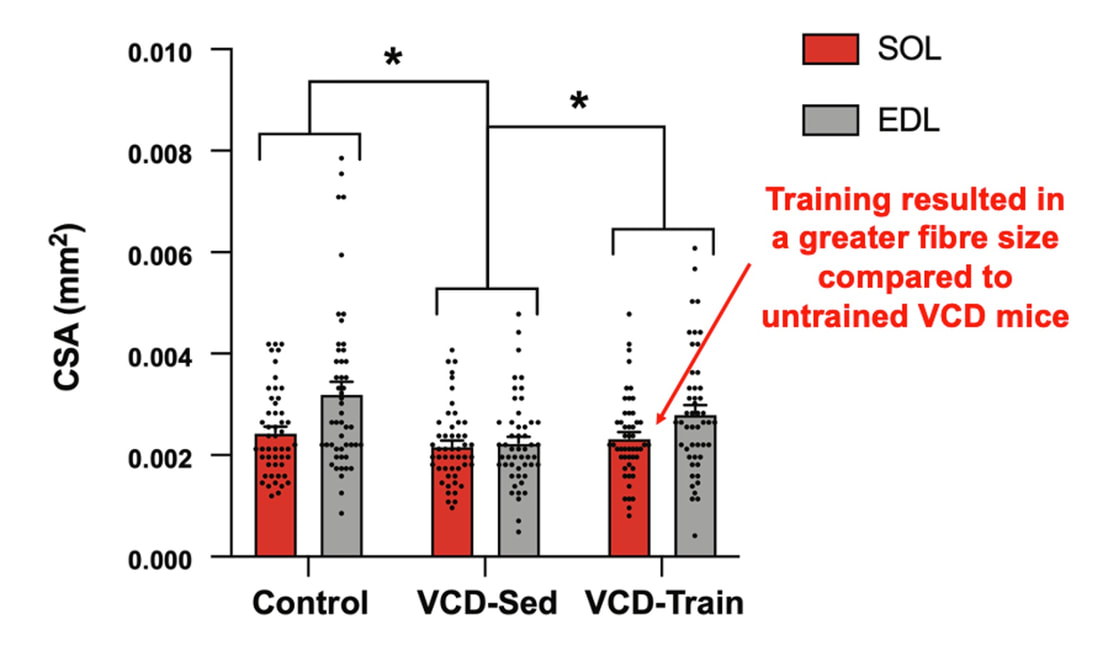 Overall, this study told us that:
Conclusion and Next StepsAssessments of menopause in animals have historically employed the ovariectomy model, which results in a sudden elimination of ovarian hormones. The natural trajectory of menopause is more gradual, including a transition phase of perimenopause. By instead inducing gradual ovarian failure in mice, the VCD model has allowed us to gain a better understanding of how muscle fibre function changes leading up to and following menopause. We now know that during perimenopause, there is a shift toward a greater proportion of fast twitch muscle fibres, which manifests as fibres being larger, producing greater force, and producing force more rapidly. This fibre type shift may be compensatory, because later into menopause, we see reductions in fibre size, force, and power. High intensity interval training at the onset of menopause, however, can alleviate those impairments in muscle fibre function. 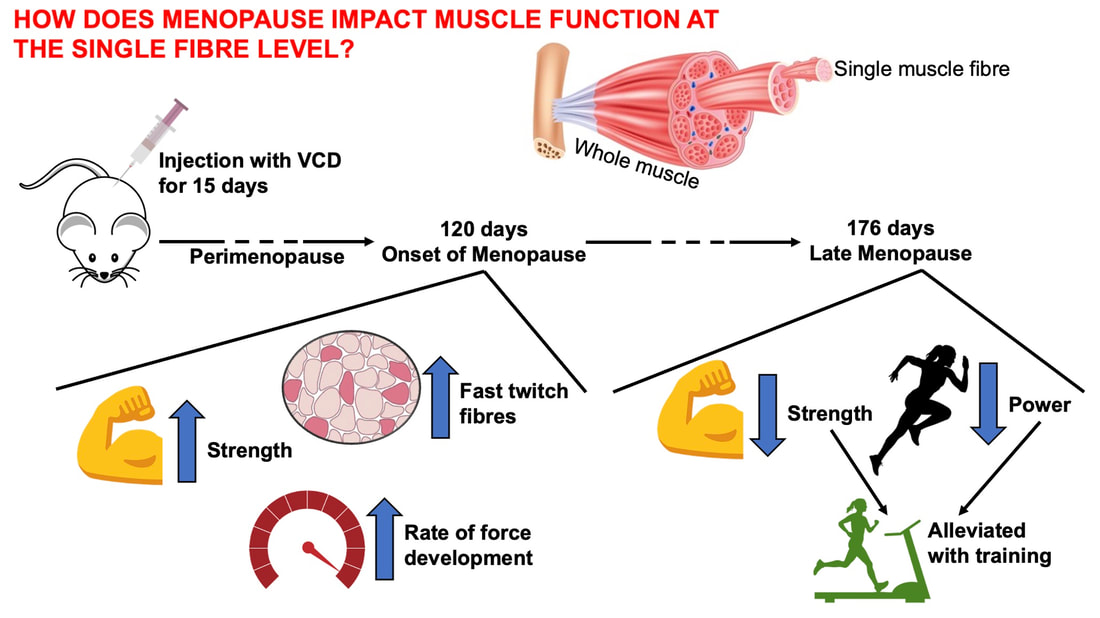 These findings were at the level of the muscle fibre. Therefore, we do not know how the effects of menopause on muscle fibre function would translate to the performance of several muscles surrounding a joint. Those assessments, of course, could be more applicable to everyday life. Our lab is currently looking into that exact topic, repeating the above experiments on mice for joint-level assessments of muscle performance (pictured below). 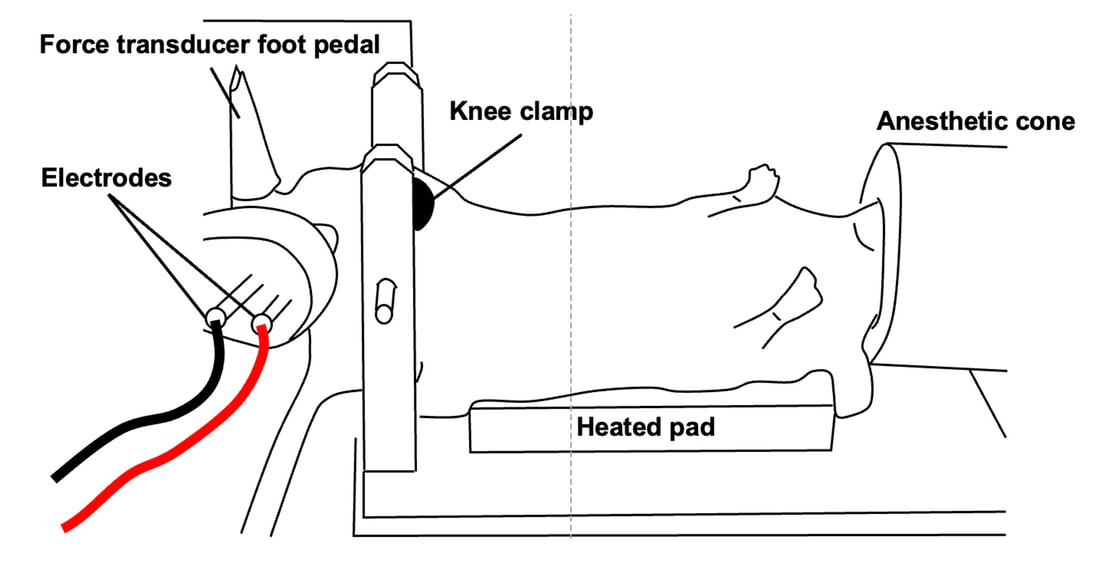 References
Mashorui P, Saboune J, Pyle WG, Power GA. Effects of chemically induced ovarian failure on single muscle fiber contractility in a mouse model of menopause. Maturitas. 2023 November 11. https://doi.org/10.1016/j.maturitas.2023.107885 Hubbard EF, Mashouri P, Pyle WG, Power GA. The effect of gradual ovarian failure on dynamic muscle function and the role of high-intensity interval training on mitigating impairments. Am J Physiol Cell Physiol. 2023 Oct 1;325(4):C1031-C1045. doi: 10.1152/ajpcell.00318.2023. Epub 2023 Sep 4. PMID: 37661923. By Avery Hinks Fifty-four years ago, humans went to the Moon. While at that time traveling even further seemed like science fiction dreamed up by Philip K. Dick, we are now apparently a decade away from the first manned trips to Mars. It won’t be long before space travel becomes more available to the general public. Researchers are of course already considering the impact long-term spaceflight would have on the human body, in particular its muscles. What has perhaps been given less consideration is the different populations that will travel to space as it becomes more available. In our lab, we especially think about older individuals.  William Shatner, at 90 years old, becoming the oldest person to travel to space. From: https://www.space.com/how-space-tourism-could-affect-older-people What happens to muscles during spaceflight?You probably know that physical inactivity is not good for your muscles. Whether you’re on bed rest at the hospital, your arm is in a sling after an injury, or you’re too immersed in Game of Thrones to leave your couch, your muscles will atrophy if you continue to not use them. But did you know that even when you’re not actively using your muscles, they are still bearing some weight that helps sustain them? It’s the same reason an apple once fell on Isaac Newton’s head. Gravity. In space, there is no gravity acting on your limbs for your muscles to resist, so they begin losing mass rapidly. With as few as 8 days in space, astronauts can lose 6% of the muscle volume in their calf muscles. When approaching 6 months in space, this loss is closer to 25% (see the dark blue line in the figure below). These numbers are also regardless of any in-flight countermeasures such as exercise. Currently, traveling to Mars is projected to take about 9 months. That gives a lot of time for zero-gravity to wear away at one’s muscles! 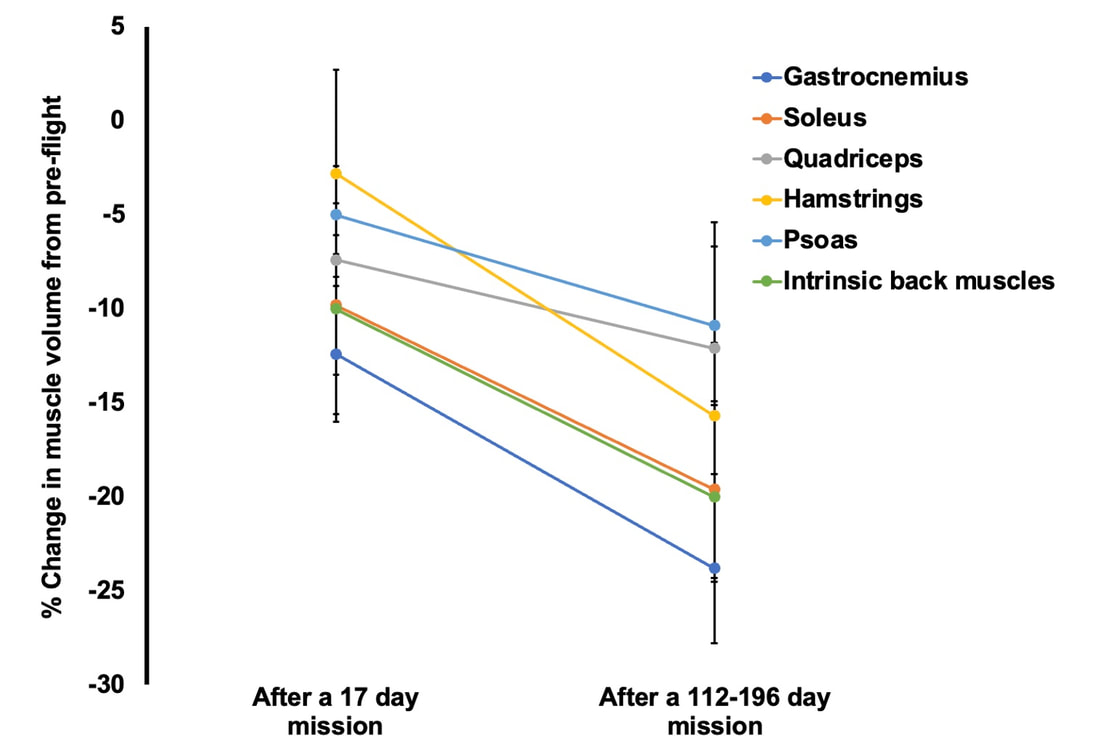 Figure adapted from LeBlanc et al. (2000), Journal of Applied Physiology This loss of muscle mass has severe consequences on physical function, most notably a reduction in strength. The % loss of strength actually seems to exceed the loss of muscle mass. Looking again at the calf muscles, strength can decline around 40% for a 6-month mission. The reason for the decline in strength exceeding that of muscle mass is likely due to the neural component of muscle contraction. That means the connection between the brain and muscle declines during spaceflight as well! We can also assess muscle strength using electrically stimulated contractions to eliminate the neural component, isolating performance of the muscle itself. A study by Koryak in 2001 on Russian astronauts tested both voluntary and electrically stimulated strength of the calf muscles after 115-380 days of spaceflight. They indeed saw that the average decline in voluntary strength was 42% (the top graph below) while the decline in electrically stimulated strength was only 26% (the bottom graph below). 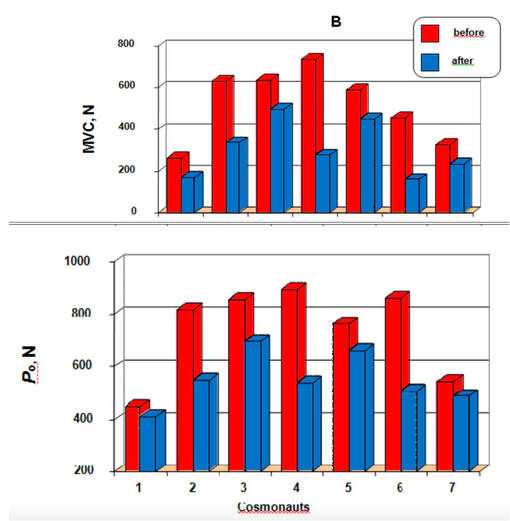 Figure from Koryak (2001), Acta Physiologica et Pharmacologica Bulgarica A study by Narici and colleagues in 2003 compared this to only 17 days of spaceflight. In the graph below, focus on the points at 50 Hz, as that represents the maximum electrical stimulation. Interestingly, when assessing electrically stimulated calf muscle strength, there was no decline in strength at the end of the mission (FD16 in the graph below). Instead, researchers observed the biggest loss of strength (around 22%) 8 days after returning to Earth (R + 8 in the graph below). They concluded this delayed strength loss was due to the muscles undergoing damage while being re-introduced to gravity. 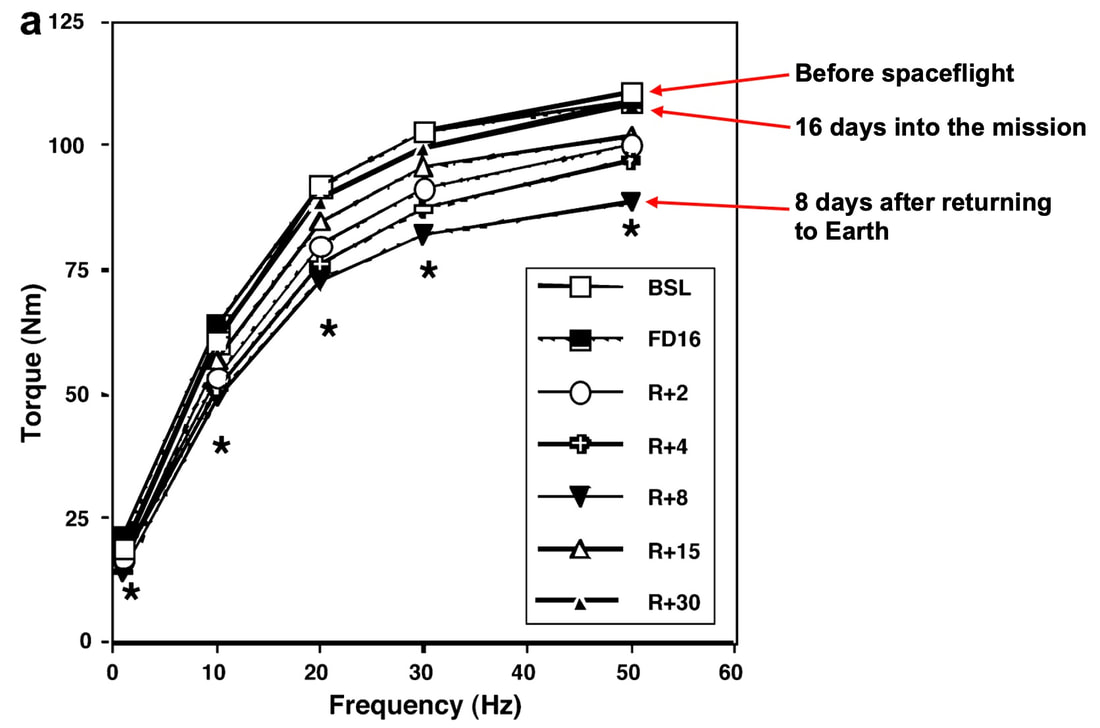 Figure from Narici et al. (2003), European Journal of Applied Physiology The loss of muscle mass with aging = the loss of muscle mass during spaceflight?A recent article in Aging Research Reviews by Capri and colleagues argued the physiological stresses that occur during spaceflight can be seen as an “acceleration” of what is seen in natural aging. To that end, the loss of muscle mass with age is comparable to the (much faster) loss of muscle mass during spaceflight. Comparing thigh muscle size between men aged ~70 and ~30, Lexell and colleagues found the 70-year old men’s muscles were 18% smaller. A study by Frontera and colleagues later tracked men for 12 years starting at about age 65, and observed a 14-16% loss of thigh muscle size over time. That’s up to a 1.3% loss of muscle size per year after age 65. 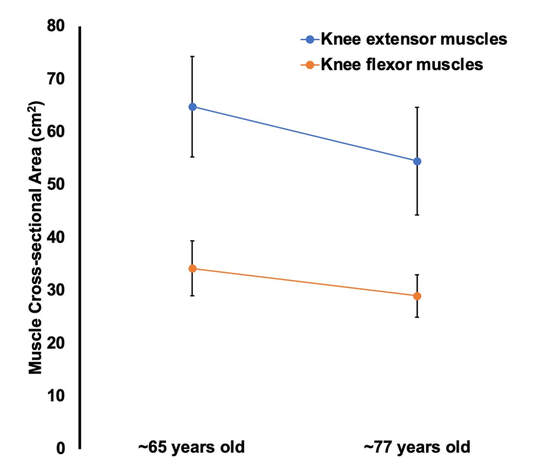 Figure adapted from Frontera et al. (2000), Journal of Applied Physiology Like during spaceflight, the loss of muscle strength with age may be even more drastic. In the study mentioned above, they also assessed strength (torque in the graph below) of those muscle groups in shortening contractions. Across the 12-year period, strength declined by 24-29%. 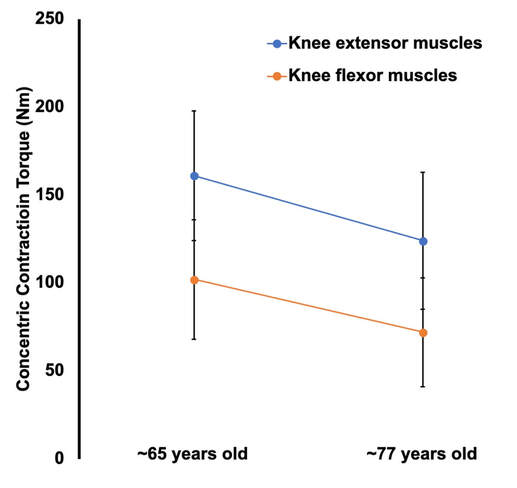 Figure adapted from Frontera et al. (2000), Journal of Applied Physiology These effects of aging on muscle are not only a concern above the age of 60. A review by Vandervoort from the University of Western Ontario in 2001 compiled data across several studies. As seen in their graph below, muscle strength declines steadily throughout adulthood, with on average about a 10% decline from age 20 to 50 for isometric (static muscle length) and concentric (shortening) contractions. 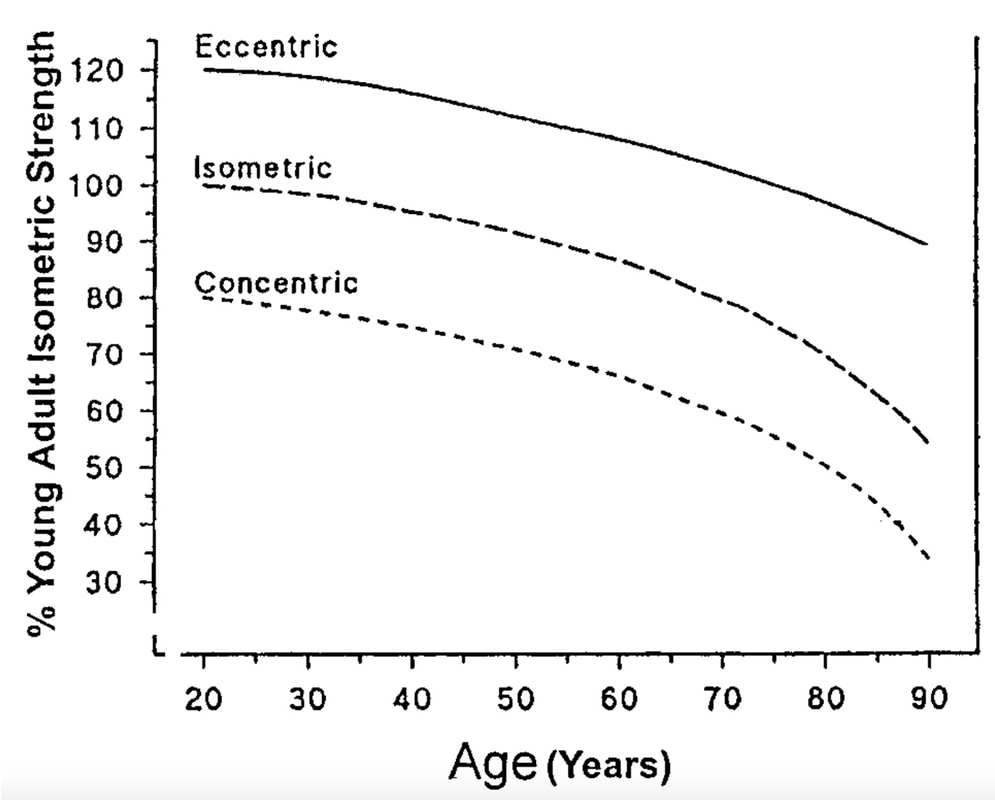 Figure from Vandervoort (2001), Muscle & Nerve In 2021, at 90 years old, William Shatner became the oldest person to travel to space. The previous record, set earlier that year, was Wally Funk at age 82. As they only remained in space for about 10 minutes, the risks on muscle function were minimal. However, options for longer flights will inevitably arise as space tourism continues to advance. When that happens, should we be prepared for the effects of aging and spaceflight compounding? Maybe we should already be concerned—in the spaceflight studies discussed earlier, some of the astronauts were over 50 years old! How can we assess this on Earth before going to space?We of course can’t send people to space every time we want to gain insight on how spaceflight impacts muscle mass and strength. Thankfully, there are a few options we can test down here on Earth that yield similar outcomes. Namely, there are three methods: bed rest, lower-limb suspension, and immobilization. Bed rest is exactly as it sounds—a person is confined to lying in bed. With lower-limb suspension, the person is free to move, but one leg is kept suspended off the ground. Immobilization is similar, but the leg is instead held in a cast. 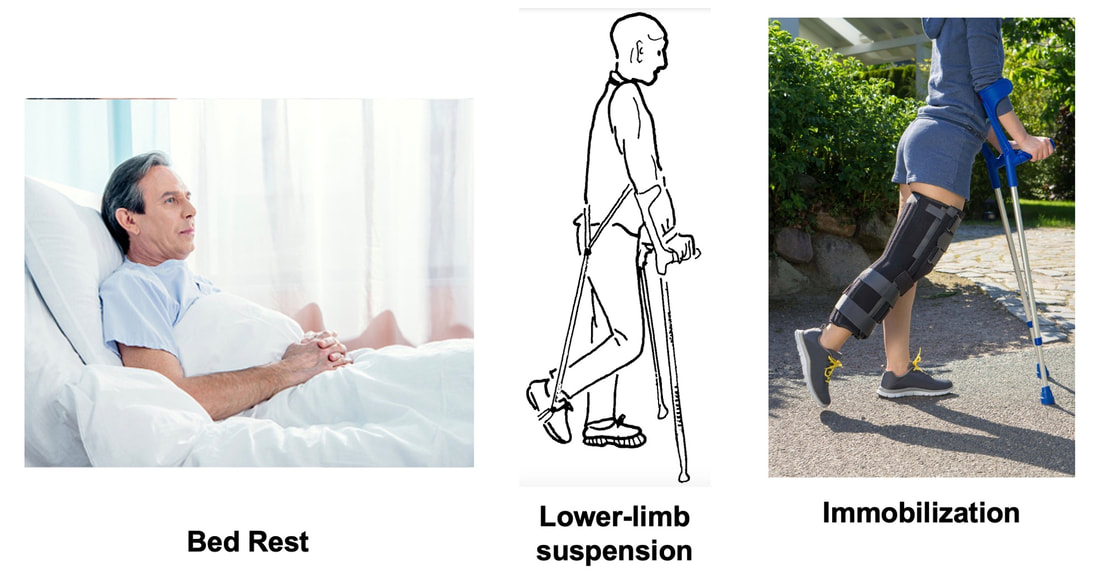 Bed rest is the most popular because it can be combined with a head tilt, which mimics the fluid shift that occurs in space to reproduce some of spaceflight’s systemic effects. Regarding muscle, however, all three options produce reductions in mass and strength that are comparable to spaceflight. A review by Narici and de Boer in 2011 demonstrated similarities among all models. The graph below is from their review, showing decreases in size of the calf (PF) and quadriceps (KE) muscle groups for spaceflight (SF), bed rest (BR), and lower-limb suspension (ULLS). While data for immobilization aren’t shown on the graph, the authors noted the loss of muscle size is 10-12% for the quadriceps after 10-14 days of immobilization, similar to spaceflight. 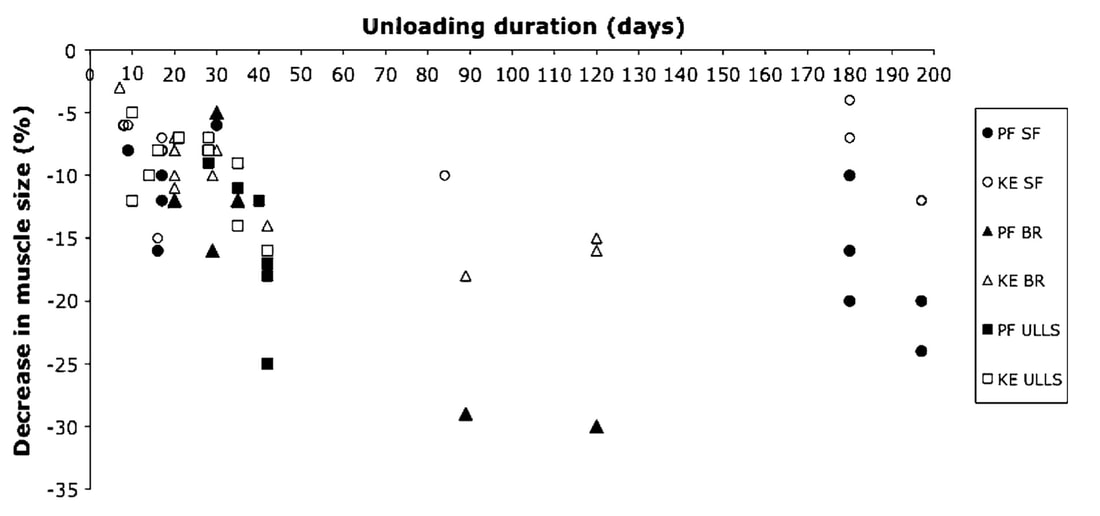 Figure from Narici and de Boer (2011), European Journal of Applied Physiology These Earth-based models have provided insight both on the decline of aged muscle during spaceflight, and the recovery of aged muscle following spaceflight compared to younger counterparts. A study by Suetta and colleagues immobilized the quadriceps of young (age 21-27) and older (age 61-74) men for 2 weeks, then investigated their recovery following 4 weeks of strength training of the once-immobilized leg. The graph below shows that young men experienced a greater percent reduction in muscle volume following the cast than older men. However, young men recovered closer to their initial muscle volume after 4 weeks of recovery. 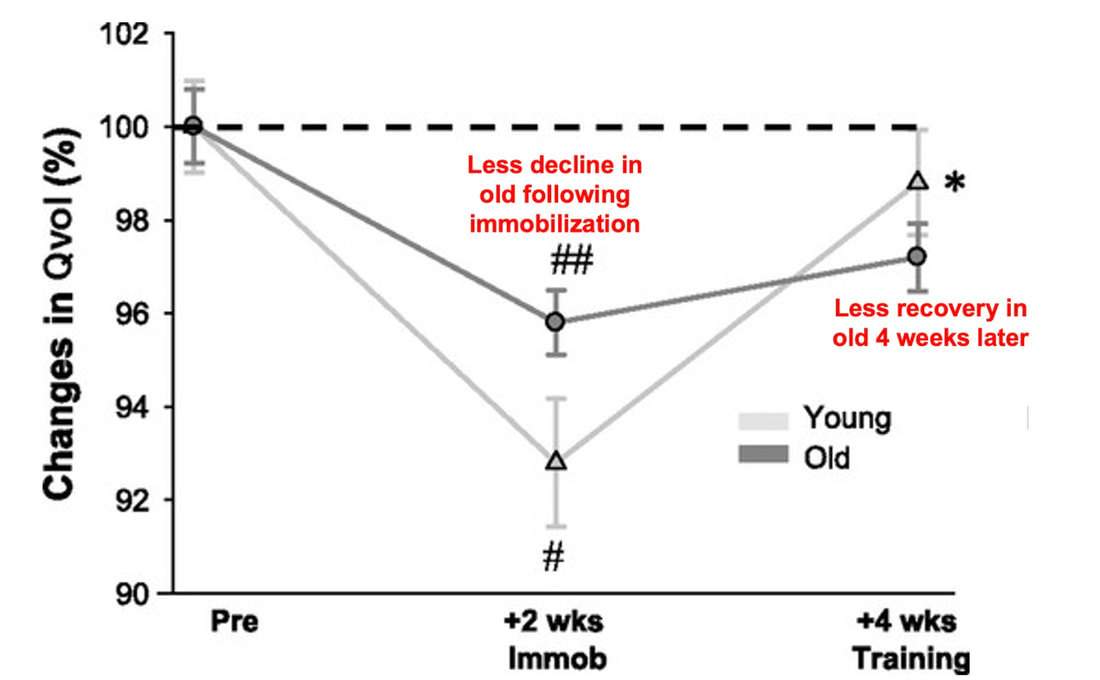 Figure from Suetta et al. (2009), Journal of Applied Physiology The literature outside of the above study are split, however. Some have reported a greater magnitude of muscle atrophy in older adults with immobilization, while others have reported greater atrophy in younger adults. These disparities are best seen in the figure below from a systematic review by Hodgson and colleagues. 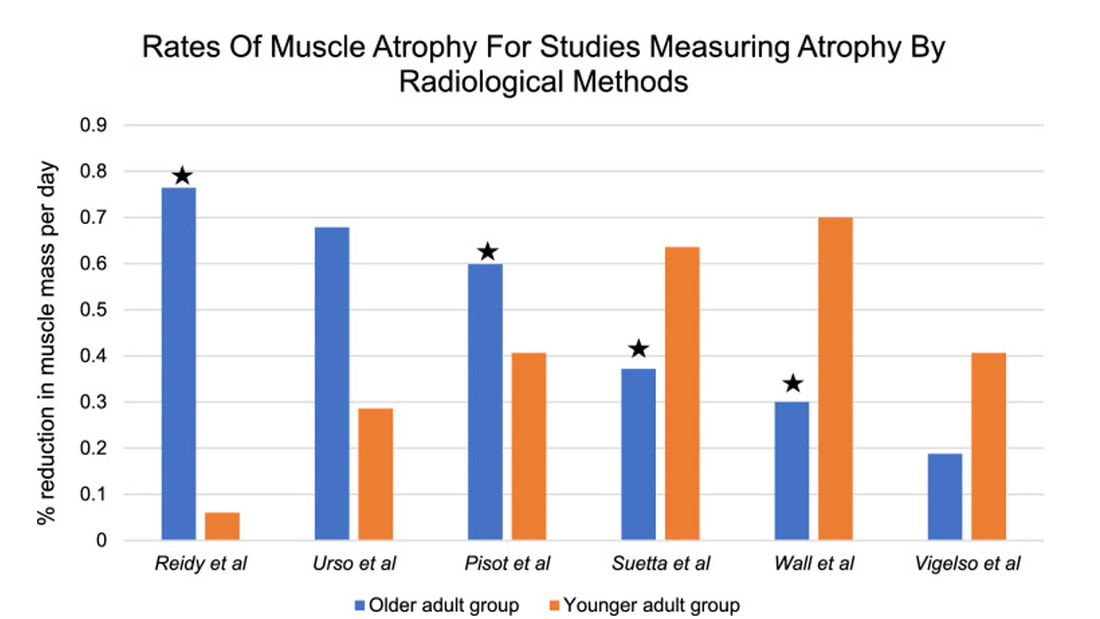 Figure from Hodgson et al. (2022), European Journal of Trauma and Emergency Surgery. The stars indicate a statistically significant difference between the younger and older group. Performing studies on old rodents also provides an opportunity to assess age-related differences in disuse atrophy and recovery more closely. For example, a study by Fisher and Brown in 1998 tested 31 and 37-month-old rats after their calf muscles were immobilized for 4 weeks. These age groups represent about 75 and 90 years old in comparison to humans. Using rats allowed the researchers to directly assess the muscle mass and the strength of individual muscles in a controlled environment. They found that both the losses of muscle mass and strength (“Po” in the graphs below) with immobilization were less in the 37-month-old rats compared to the 31-month old rats. These trends are clearly seen in the figures below when comparing the control (white) and immobilized (grey) bars. From these results, it appears that the muscle atrophy associated with disuse may be diminished when superimposed on the atrophy that already comes with aging. 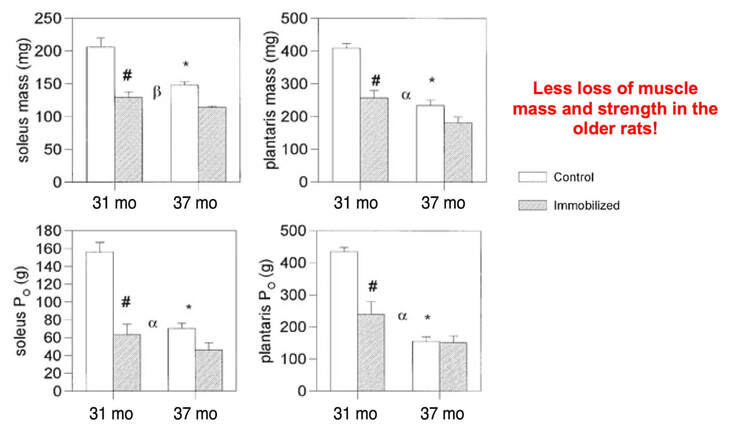 Figure from Fisher and Brown (1998), Aging Clinical and Experimental Research But how do muscles of old rats recover from immobilization compared to young rats? A study by Zarzhevsky and colleagues in 2001 provided insight, comparing rats aged 6 months to rats aged 24 months. Like the study on humans by Suetta and colleagues, they found that the muscles of old rats had a slower return to their original mass than young rats. This trend is shown in the graph below, with the bars representing the percent increase in muscle mass following 4 weeks of recovery after cast removal. 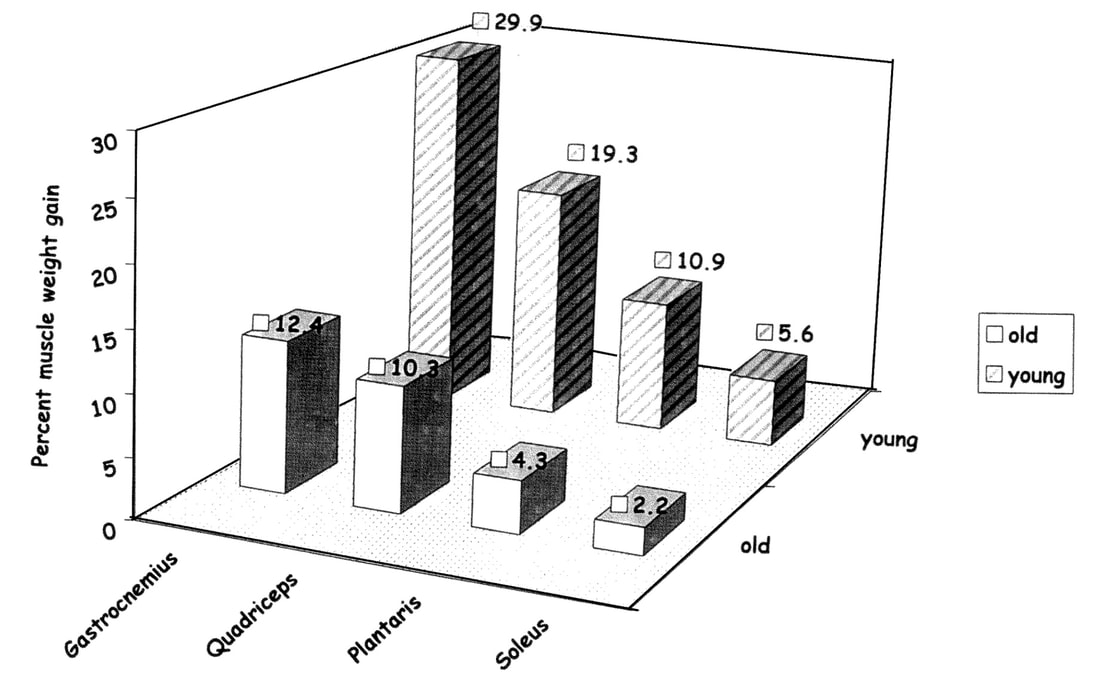 Figure from Zarzhevsky et al. (2006), Annals of the New York Academy of Sciences Conclusion Humankind is quickly advancing accessibility to space travel. As space travel becomes more common, we should consider the effects it may have on muscles of non-“young, healthy” populations, including the elderly. We may assess this without having to go to space by investigating models of bed rest, lower-limb suspension, and immobilization. Studies so far in both humans and animals suggest older adults do not experience a heightened magnitude of disuse atrophy, however, they require a longer recovery period. In order to further apply these models to spaceflight, we should aim to better understand the effects of longer periods of muscle disuse, and optimal in-flight countermeasures and pre-training. We should also investigate the effects on measures of muscle performance other than strength, such as muscle power and velocity, which provide indications of performance during movement.  References
“China plans for first manned mission to Mars in 2033” https://www.aljazeera.com/news/2021/6/24/china-plans-for-first-manned-mission-to-mars-in-2033 “William Shatner oldest astronaut at 90 – Here's how space tourism could affect older people” https://www.space.com/how-space-tourism-could-affect-older-people “Aviation pioneer Wally Funk, the oldest person to fly in space, can't wait to go back after Blue Origin launch” https://www.space.com/wally-funk-blue-origin-new-shepard-launch-reaction LeBlanc A, Lin C, Shackelford L, Sinitsyn V, Evans H, Belichenko O, Schenkman B, Kozlovskaya I, Oganov V, Bakulin A, Hedrick T, Feeback D. Muscle volume, MRI relaxation times (T2), and body composition after spaceflight. J Appl Physiol (1985). 2000 Dec;89(6):2158-64. doi: 10.1152/jappl.2000.89.6.2158. PMID: 11090562. Koryak YU. Electrically evoked and voluntary properties of the human triceps surae muscle: effects of long-term spaceflights. Acta Physiol Pharmacol Bulg. 2001;26(1-2):21-7. PMID: 11693395. Narici M, Kayser B, Barattini P, Cerretelli P. Effects of 17-day spaceflight on electrically evoked torque and cross-sectional area of the human triceps surae. Eur J Appl Physiol. 2003 Oct;90(3-4):275-82. doi: 10.1007/s00421-003-0955-7. Epub 2003 Sep 17. PMID: 13680242. Capri M, Conte M, Ciurca E, Pirazzini C, Garagnani P, Santoro A, Longo F, Salvioli S, Lau P, Moeller R, Jordan J, Illig T, Villanueva MM, Gruber M, Bürkle A, Franceschi C, Rittweger J. Long-term human spaceflight and inflammaging: Does it promote aging? Ageing Res Rev. 2023 Jun;87:101909. doi: 10.1016/j.arr.2023.101909. Epub 2023 Mar 12. PMID: 36918115. Lexell J, Henriksson-Larsén K, Winblad B, Sjöström M. Distribution of different fiber types in human skeletal muscles: effects of aging studied in whole muscle cross sections. Muscle Nerve. 1983 Oct;6(8):588-95. doi: 10.1002/mus.880060809. PMID: 6646161. Frontera WR, Hughes VA, Fielding RA, Fiatarone MA, Evans WJ, Roubenoff R. Aging of skeletal muscle: a 12-yr longitudinal study. J Appl Physiol (1985). 2000 Apr;88(4):1321-6. doi: 10.1152/jappl.2000.88.4.1321. PMID: 10749826. Vandervoort AA. Aging of the human neuromuscular system. Muscle Nerve. 2002 Jan;25(1):17-25. doi: 10.1002/mus.1215. PMID: 11754180. Narici MV, de Boer MD. Disuse of the musculo-skeletal system in space and on earth. Eur J Appl Physiol. 2011 Mar;111(3):403-20. doi: 10.1007/s00421-010-1556-x. Epub 2010 Jul 9. PMID: 20617334. Suetta C, Hvid LG, Justesen L, Christensen U, Neergaard K, Simonsen L, Ortenblad N, Magnusson SP, Kjaer M, Aagaard P. Effects of aging on human skeletal muscle after immobilization and retraining. J Appl Physiol (1985). 2009 Oct;107(4):1172-80. doi: 10.1152/japplphysiol.00290.2009. Epub 2009 Aug 6. PMID: 19661454. Hodgson H, Wilkinson M, Bowen S, Giannoudis P, Howard A. Older adults are not more susceptible to acute muscle atrophy after immobilisation compared to younger adults: a systematic review. Eur J Trauma Emerg Surg. 2022 Apr;48(2):1167-1176. doi: 10.1007/s00068-021-01694-0. Epub 2021 Jun 3. PMID: 34081160; PMCID: PMC9001571. Fisher JS, Brown M. Immobilization effects on contractile properties of aging rat skeletal muscle. Aging (Milano). 1998 Feb;10(1):59-66. doi: 10.1007/BF03339635. PMID: 9589753. Zarzhevsky N, Menashe O, Carmeli E, Stein H, Reznick AZ. Capacity for recovery and possible mechanisms in immobilization atrophy of young and old animals. Ann N Y Acad Sci. 2001 Apr;928:212-25. doi: 10.1111/j.1749-6632.2001.tb05651.x. PMID: 11795512. By Avery Hinks In research on humans, we are often limited to obtaining indirect measurements of muscle structure, with direct measurements being too invasive for our participants. Animal research permits more invasive techniques, including dissecting out the muscles to be studied. Unfortunately, whether indirect measures in humans accurately represent the more direct measures obtained from animals is largely unknown. In our lab’s recent publication in the journal Experimental Physiology titled “Ultrasonographic measurements of fascicle length overestimate adaptations in serial sarcomere number,” we addressed this area of uncertainty. Sport research prominently uses two fundamental concepts of muscle function to characterize performance. These are the Force-Length Relationship and the Force-Velocity Relationship. 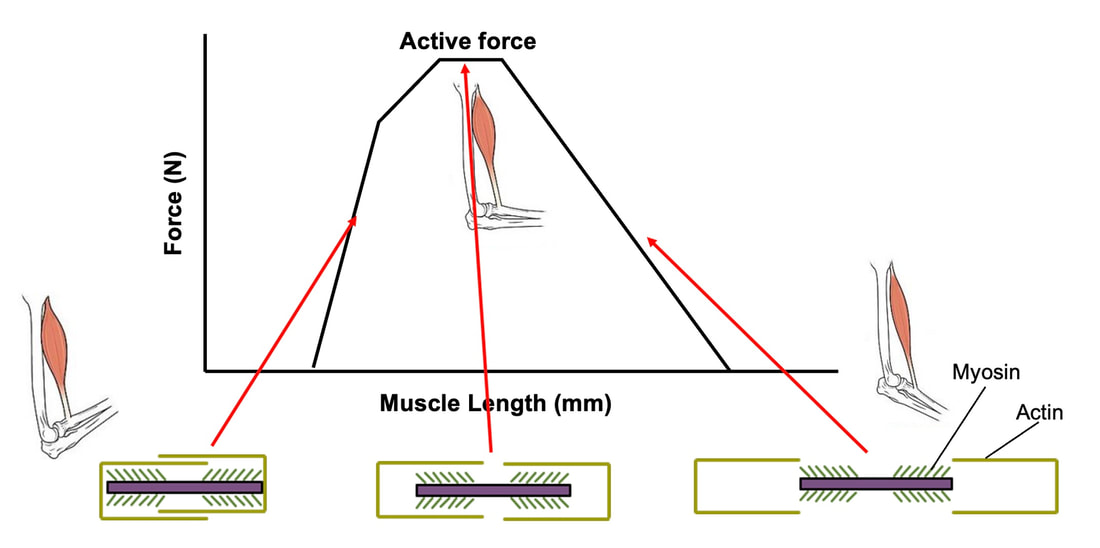 The Force-Length Relationship (above) dictates that a muscle produces suboptimal force (or in other words strength) if it is too shortened (shown on the left) or too stretched (shown on the right). The amount of force a muscle can produce depends on the alignment of the muscle’s tiny sarcomeres, those purple and green rectangles under the graph above. When the sarcomere’s myosin and actin proteins overlap perfectly (like in the middle sarcomere above), the muscle produces its maximum possible force. 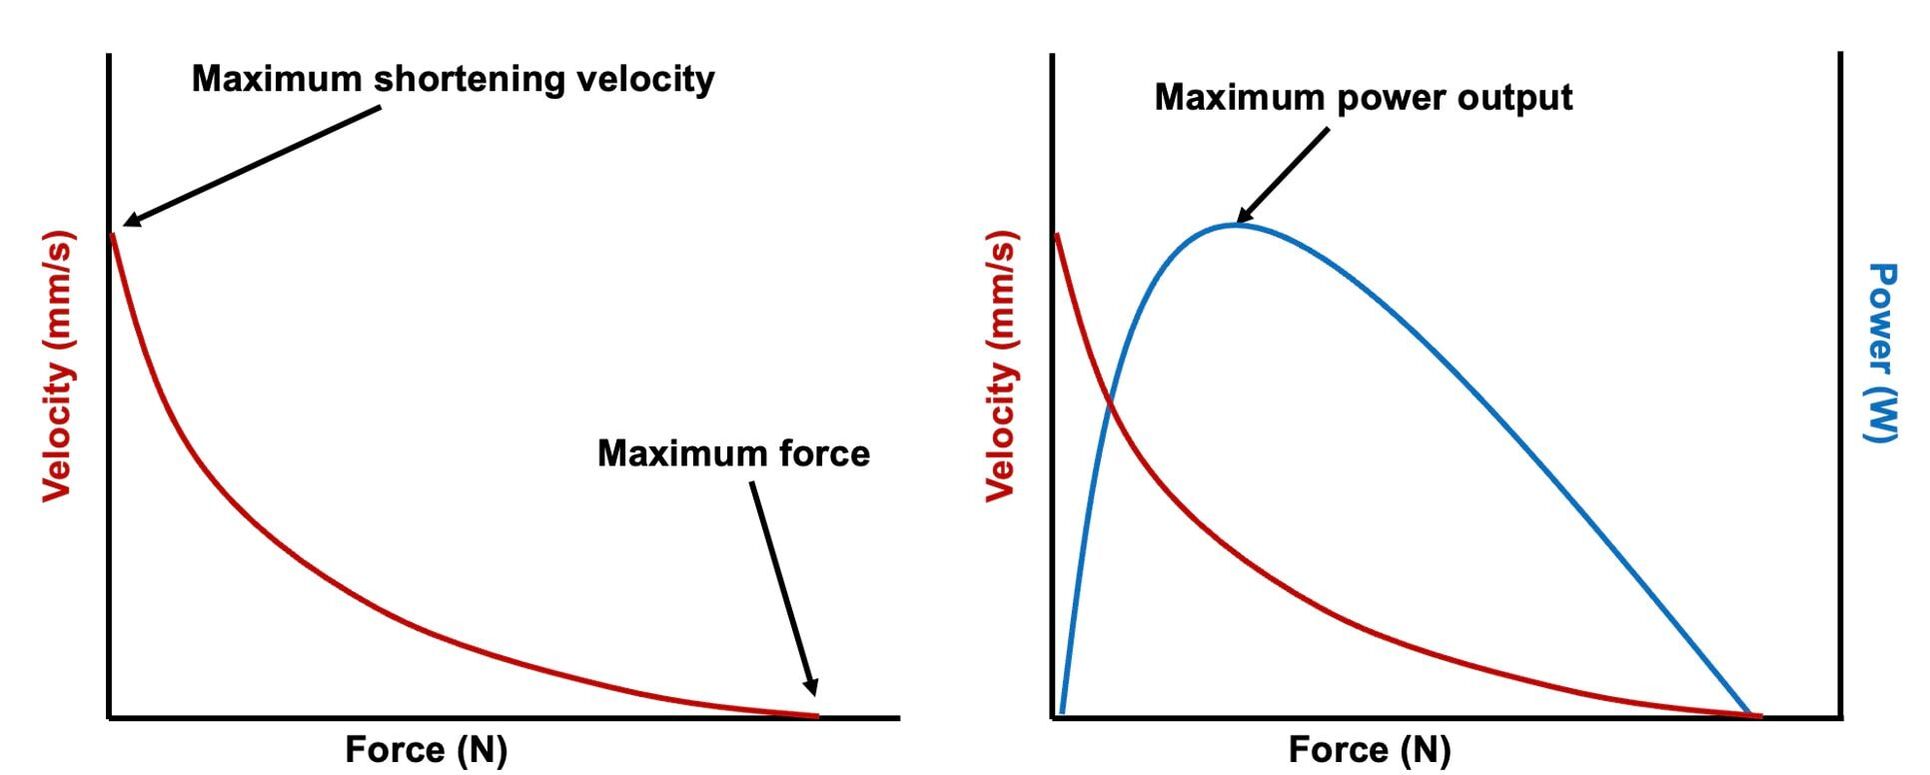  The Force-Velocity Relationship (on the left above) dictates that as a muscle shortens faster, its ability to produce force decreases. This reduction in force with increasing speed occurs because as actin and myosin proteins slide past each other faster, they become less likely to bind. Since there is a trade-off between a muscle’s strength and speed, “power” is often used to measure a muscle’s performance during movement. Power equals a muscle’s force multiplied by its velocity, and because of that (as shown above on the right), maximum power output occurs when force and velocity are both moderate. The sarcomere is the obvious commonality between the Force-Length and Force-Velocity-Power relationships of muscle. If we scale this up to the level of a whole muscle, we must consider the “serial sarcomere number,” which is the number of sarcomeres sitting side by side along the length of the muscle. To paint a better picture of what that looks like, consider this: at optimal muscle length, a human sarcomere is approximately 2.6 µm (or 0.00026 cm) long, and a whole human muscle such as the biceps brachii can be about 11 cm long. That means over 40000 sarcomeres could run from end to end along the human bicep muscle.  So, if we are to understand why a muscle’s performance improves with resistance training or declines with age, measuring adaptations in serial sarcomere number should provide insight, right? That’s the problem…we can’t really measure serial sarcomere number in humans. Measurement of muscle structure in animals versus humans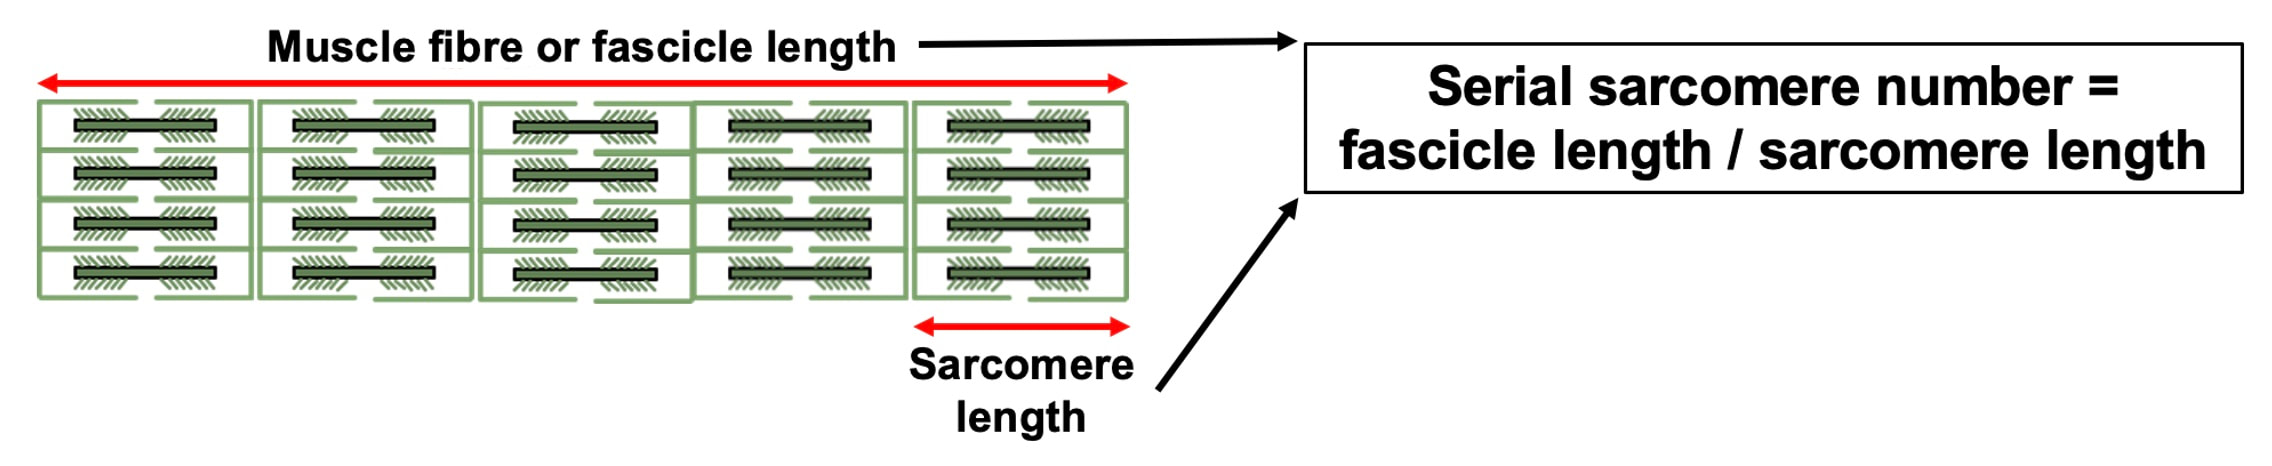 Because a muscle has thousands of sarcomeres, serial sarcomere number is calculated (see the equation above) rather than counted. To do this, we need to two numbers: the average length of the muscle’s fibre or fascicle, and the average length of the sarcomere in the muscle. 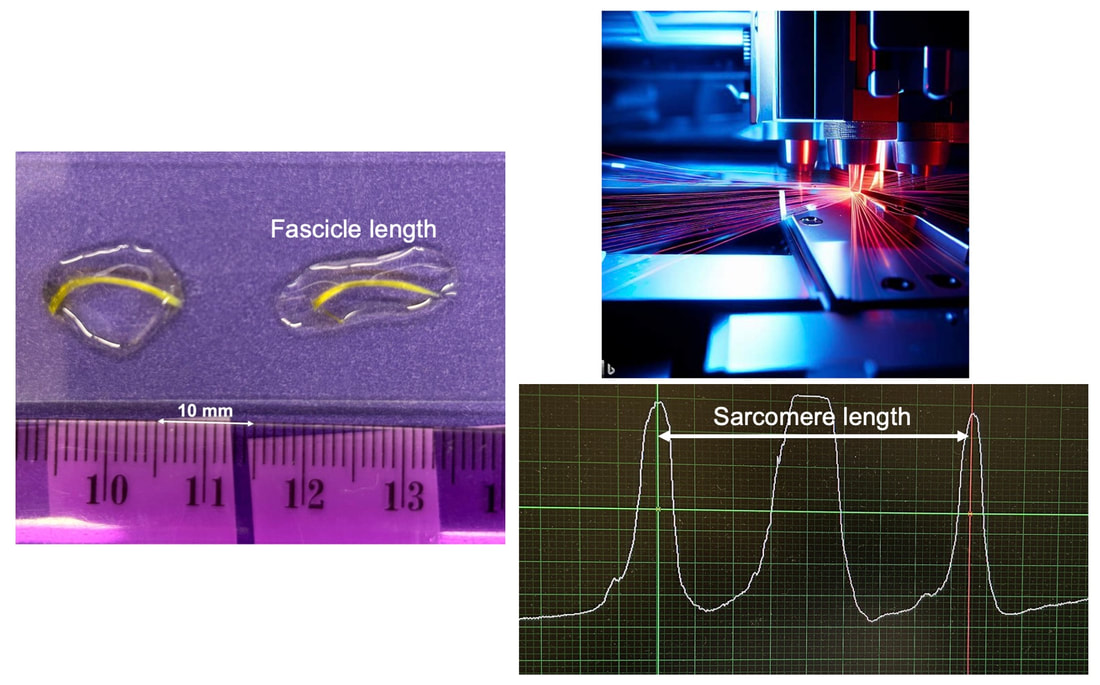 In rats and mice, performing this calculation is easy. We can dissect out the muscle of interest. We can then tease the muscle apart to obtain individual fascicles, which we can then measure the length of from end to end (on the left above). Lastly, we can measure the sarcomere length within that fascicle using a tool called “laser diffraction,” in which a laser is shone through the fascicle (on the right above). We of course cannot dissect a human’s muscles out of their body, and therefore cannot shine a laser through their fascicles either. Some studies have had the opportunity to perform such measurements on humans during surgeries, but that is rarely available. 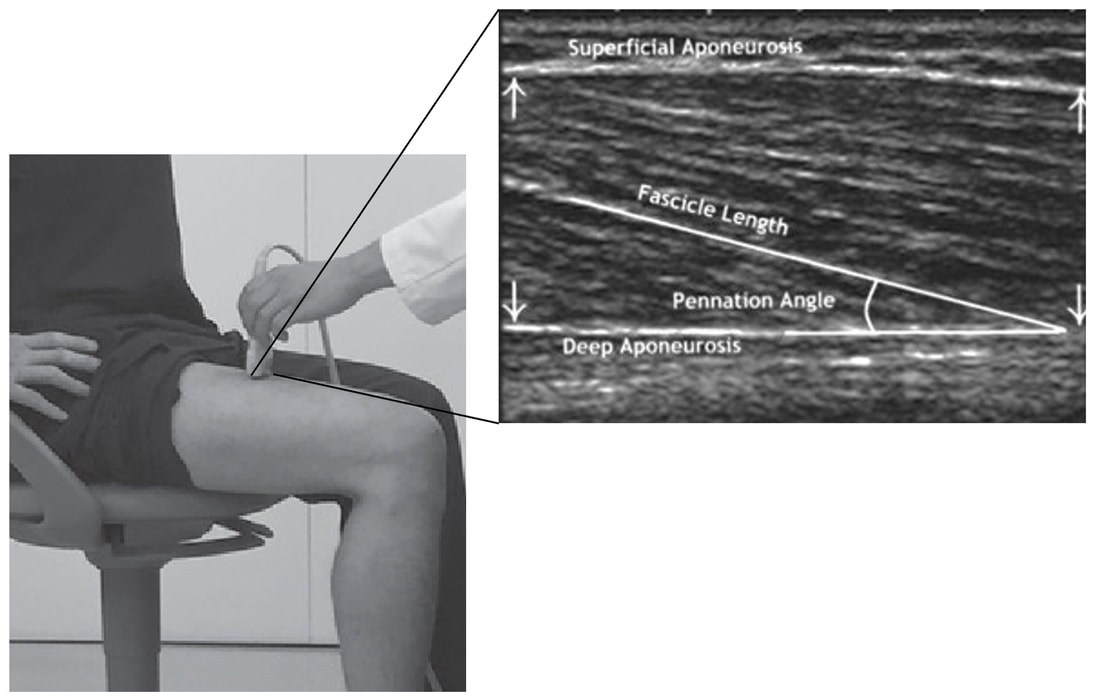 In humans, we typically measure a muscle’s structure by performing ultrasound (the probe being applied to the leg above). From ultrasound, we obtain an image depicting a muscle’s fascicles. A muscle fascicle is, as discussed earlier, comprised of many sarcomeres aligned in series. It follows that measurement of “fascicle length” with ultrasound (as shown on the right above) is often used as a proxy for serial sarcomere number in human muscle. However, without knowing a muscle’s sarcomere length at the position in which ultrasound images were obtained, we cannot be certain that fascicle length is representing serial sarcomere number. Consider the example below. Let’s say we measure fascicle length of the vastus lateralis (a thigh muscle) with the knee at a 90° angle. We obtain a measurement of fascicle length. This individual’s sarcomeres could be a neutral length (A) at this knee angle, but they could also be more shortened (B) or more stretched (C). If we do the math, it’s clear each of these possibilities would yield a different serial sarcomere number. We don’t know for certain. 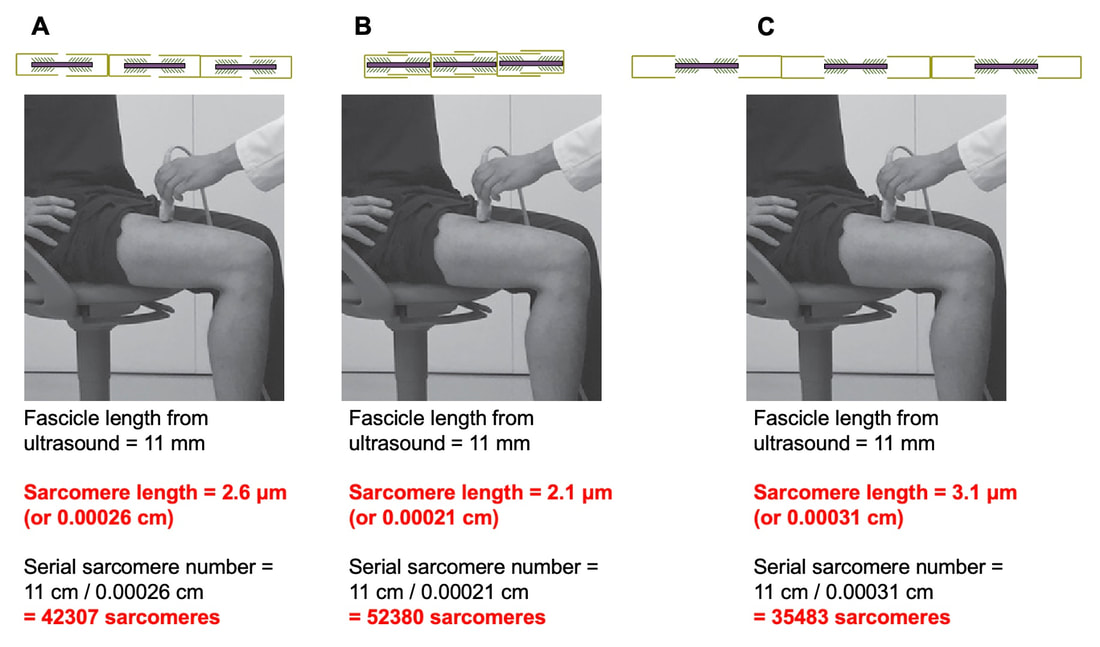 This becomes a BIG problem when attempting to explain functional declines with age or functional improvements with sports. If an elderly individual’s muscle begins to become slower or less powerful, but ultrasound measurements show a “normal” fascicle length when in fact they’ve lost sarcomeres, we are missing an important piece of the puzzle. Still, ultrasound is a relatively easy, non-invasive method, so our lab wasn’t ready to discount it. That’s what led us to our study published in Experimental Physiology. Using rats to validate ultrasound as a predictor of serial sarcomere numberUltrasound can be performed on the muscles of rats, too. So, what if we measure muscle fascicle length using ultrasound, then dissect out that muscle and perform serial sarcomere number measurements using laser diffraction? That’s exactly what we did. 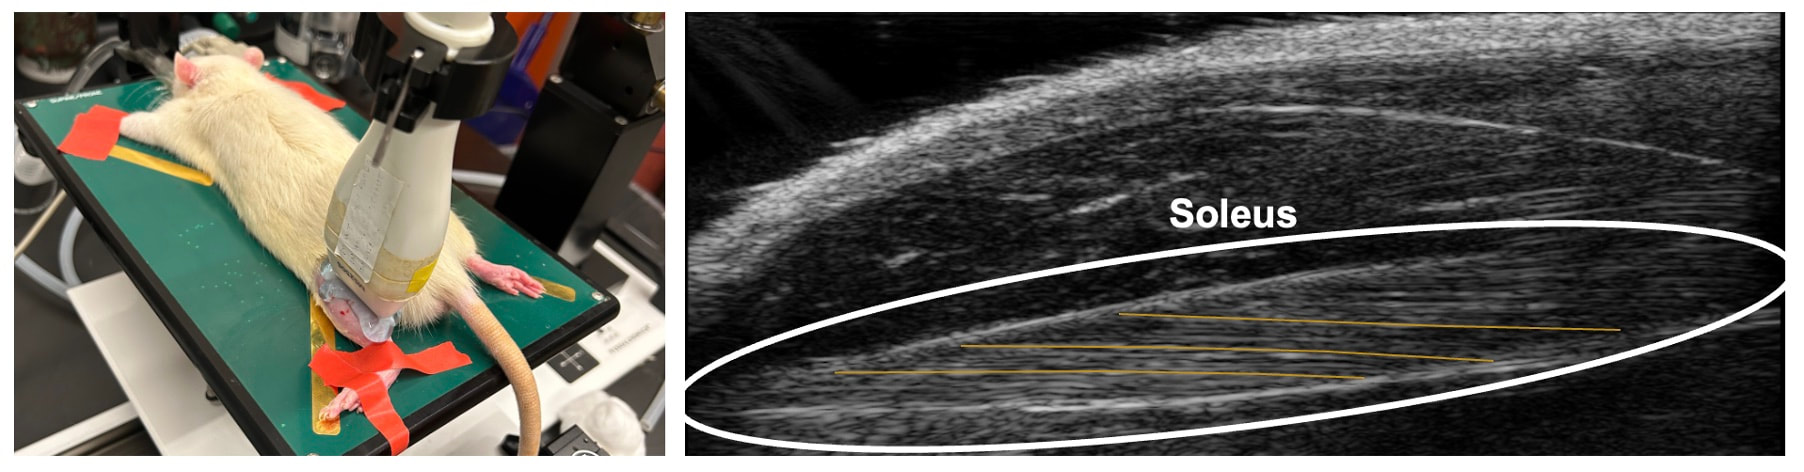 We also wanted to test the ability for ultrasound to detect serial sarcomere number adaptations, not just serial sarcomere number alone. To do this, we casted the rat’s ankle in a dorsiflexed position, stretching the calf muscles (the muscles you’d use to stand on your toes), for two weeks. This casting intervention’s chronic stretch has consistently increased serial sarcomere number in previous studies on rats. We performed ultrasound measurements on the soleus, which is the calf muscle most affected by this intervention. 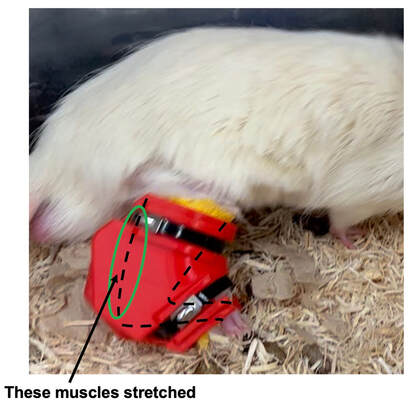 After two weeks, we removed the cast, then dissected out the soleus of both the casted and un-casted legs. By obtaining both soleus muscles, we could measure the percent increase in serial sarcomere number from the un-casted to the casted leg. We could then compare this percent increase to the percent increase in fascicle length detected by ultrasound from pre to post-cast. 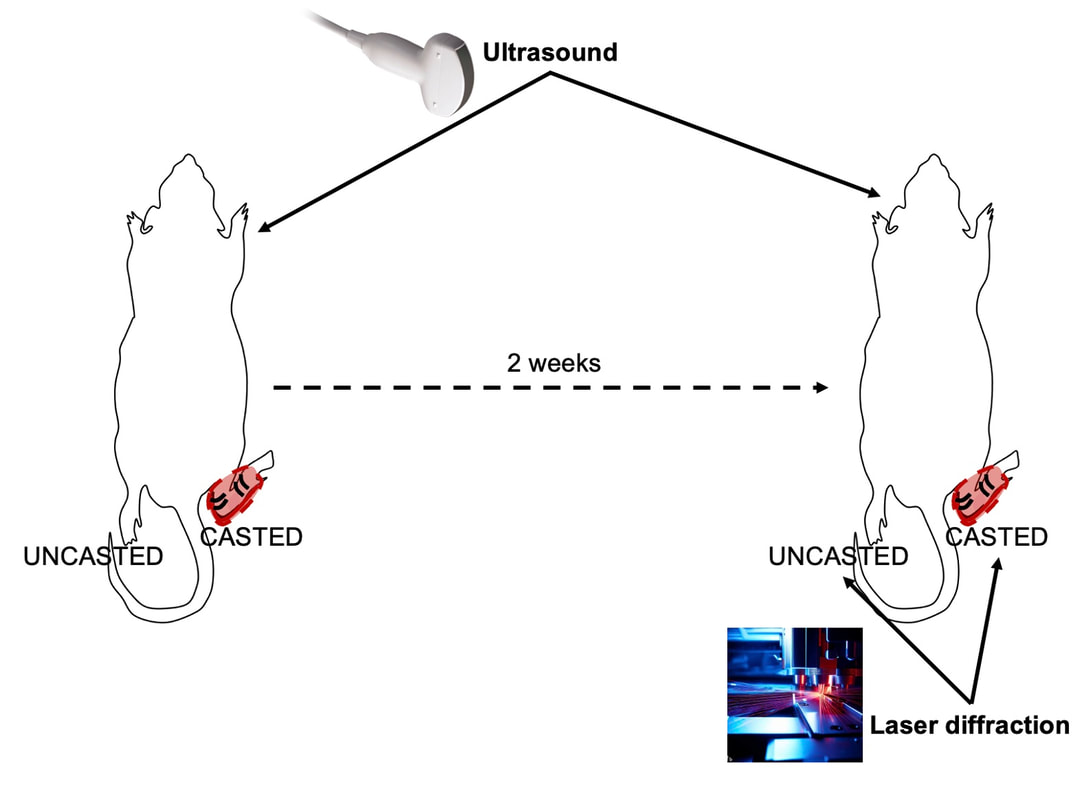 Even further, we obtained ultrasound measurements at two different ankle positions: a neutral position (with the ankle at 90°) and a fully stretched position. We also took measurements at three regions along the soleus: proximal (closer to the knee), middle, and distal (closer to the ankle). By taking these extra steps, we hoped to determine which joint positions and regions of muscle provided the best estimate of actual serial sarcomere number adaptations. Did fascicle length adaptations detected by ultrasound correspond to adaptations in actual serial sarcomere number?The graphs below show fascicle length measured by ultrasound from pre to post-cast for the casted soleus (top) and the un-casted soleus (bottom). In the casted soleus, we detected an overall 11% increase in fascicle length. This 11% increase was consistent across the two joint positions, but was most pronounced in middle and distal soleus fascicles. In the un-casted soleus, we detected no changes in fascicle length from pre to post-cast, which reassured that we could use that muscle as the control in our serial sarcomere number comparisons. 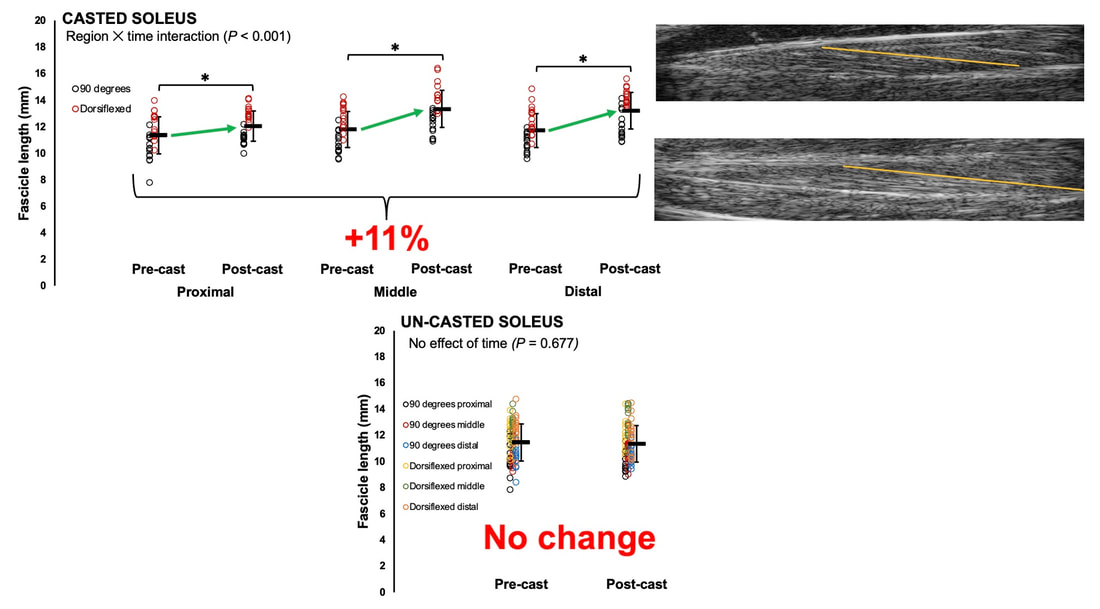 But how did these adaptations detected by ultrasound compare to the actual serial sarcomere number adaptations? The graph below shows that we indeed detected an increase in serial sarcomere number from the un-casted to the casted leg. However, the increase was only 6%. That’s 5% less than the increase detected by measuring fascicle length with ultrasound. 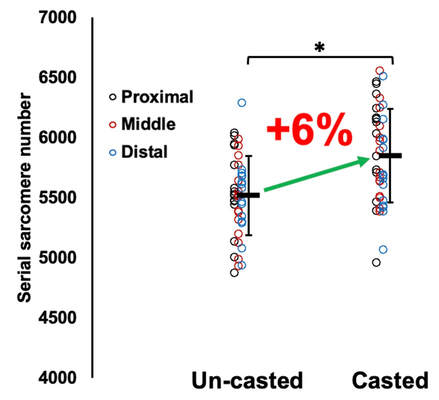 We also conducted an analysis to see if fascicle length measured by ultrasound related to actual serial sarcomere number across both legs. While the relationships were statistically significant, they were weak. By looking at the R^2 values (an indicator of the strength of a relationship), we also saw that fascicle length measurements in a neutral position (left below) better corresponded to actual serial sarcomere number than measurements in a fully stretched position (right below). 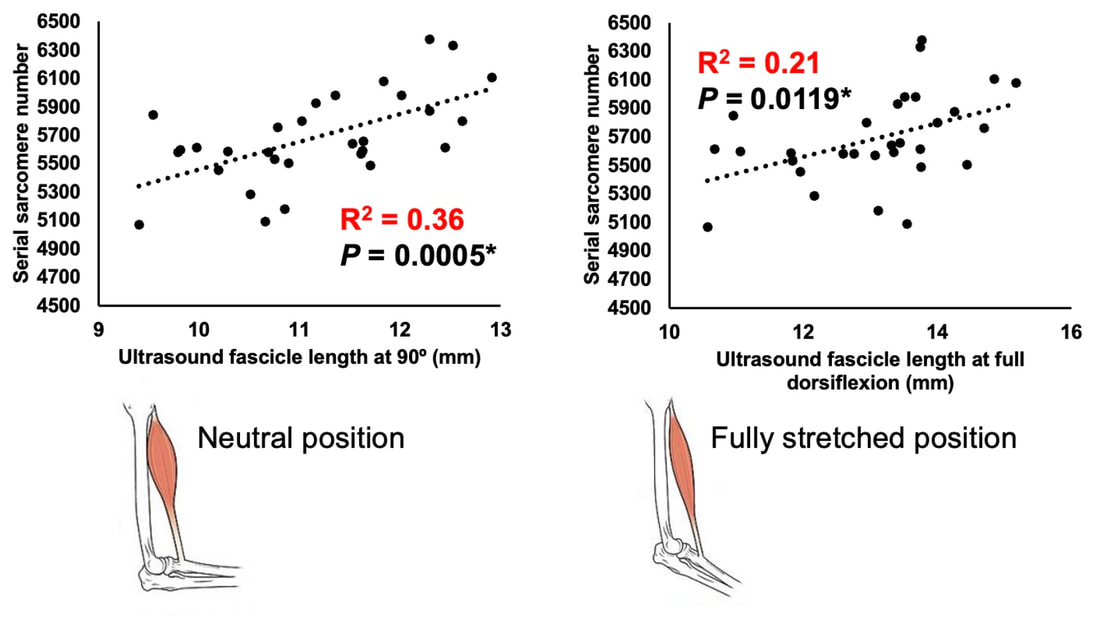 Altogether, this study provided two important take aways:
Future directions of this workWhile this study directly answered our question of whether ultrasound measurements of fascicle length correspond to actual serial sarcomere number, we shouldn’t stop here. It seems that a correction factor needs to be applied when estimating serial sarcomere number adaptations from ultrasound-derived fascicle length measurements. To further build on the 5% correction factor we observed, future studies should perform similar investigations in other muscles, interventions, and animal models. For example, using a 1 or 4-week duration instead of 2 weeks, employing a training intervention, or investigation sarcomere loss after a period of disuse. These altogether will help strengthen applicability to human populations, and improve our understanding of how adaptations in muscle structure influence muscle function.  By Avery Hinks In a previous knowledge translation, we discussed the proverbial “Old Man Strength.” As we age, our muscles become weaker. However, this loss of strength is seen primarily in concentric (shortening) and isometric (static) muscle contractions. In eccentric (lengthening) muscle contractions, strength is well-maintained into old age. 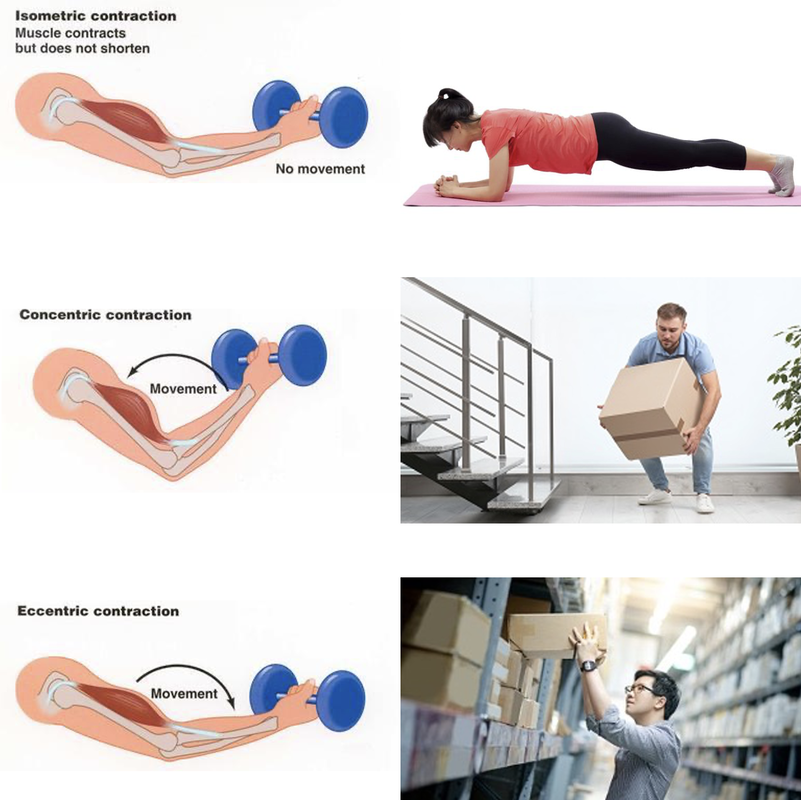 An important feature of eccentric contractions is their ability to induce muscle damage. When performing many repeated, high-intensity eccentric contractions, the structures within your muscle called sarcomeres stretch so drastically that they tear apart. As a result, the muscle becomes injured, with deficits in strength lasting as long as a week.  Figure on the right is from Clarkson and Tremblay (1988), Journal of Applied Physiology. For further information, read our previous knowledge translation: Eccentric Exercise-Induced Muscle Damage and the “Repeated Bout Effect” Explained. Alongside loss of strength, injuries can also be more severe and prevalent in old age. Knowing eccentric strength is maintained in old age, however, you might wonder if older individuals are also protected from further muscle injury induced by eccentric exercise. The short answer is a common phrase in the field of muscle physiology: “it depends.” What do studies on animals show?In the 1990s, there were two prominent investigations into the influence of old age on muscle damage following eccentric exercise. One of these investigations was in mice, and the other in rats.  The first study, by Brooks and Faulkner, exposed old (~27 months old) and young (~3 months old) mice to eccentric exercise. They used the ankle dorsiflexor muscle group (the muscles used to point your toes up toward your head), and the exercise consisted of three 5-minute bouts of eccentric contractions. 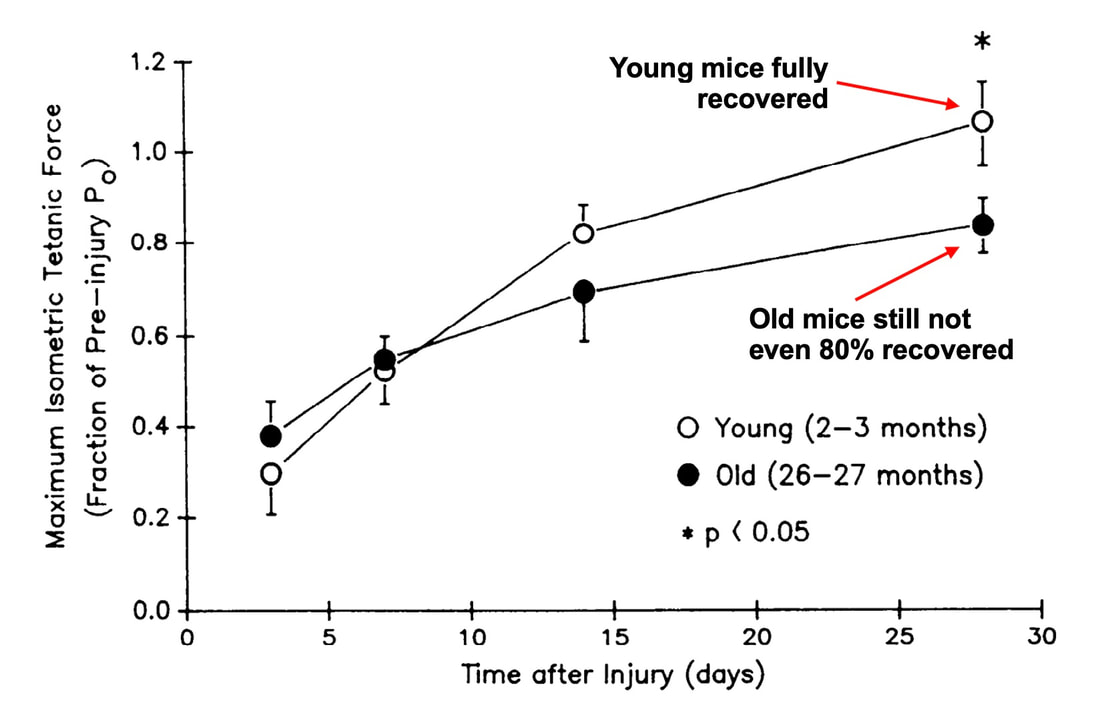 Figure adapted from Brooks and Faulkner (1990), American Journal of Physiology-Cell Physiology The graph above shows recovery of maximum strength in the young and old mice 3 to 28 days following the eccentric exercise. At 3 days, the old and young mice both exhibited a ~35% drop in strength compared to pre-exercise. These results indicate old and young mice experienced a similar degree of muscle damage. Old and young mice differed in their long-term recovery, however. Young mice recovered over 80% of their initial maximum strength at 14 days and were fully recovered by 28 days. Old mice did not even recover to 80% by 28 days. An additional assessment at 60 days also showed they still had not recovered. In 1995, McBride and Carlsen performed a similar study on old (~32 months old) and young (~6 months old) rats. Their investigation also used the ankle dorsiflexors, and consisted of four sets of six eccentric contractions. 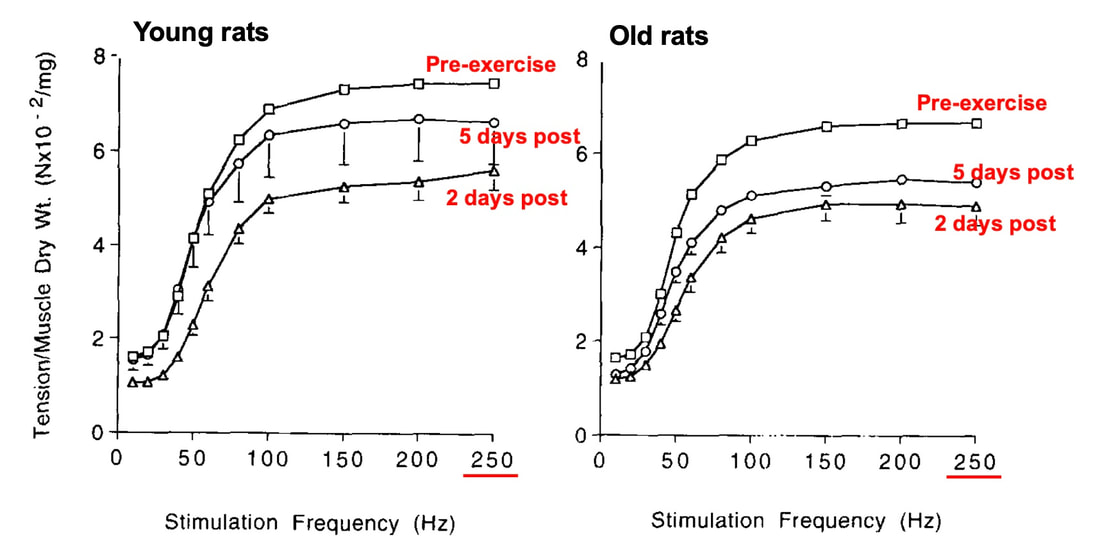 Figure adapted from McBride and Carslon (1995), Mechanisms of Ageing and Development In the graphs above, focus on the values at 250 Hz (underlined in red), as those are the indicators of maximum strength. Like the mouse study, the young and old rats exhibited about the same initial drop in maximum strength (about 30% of pre-exercise) at 1 and 2 days following eccentric exercise. When tested at 5 days, the young rat muscles had recovered while the old rats remained deficient in strength by about 18%. This rat study went one step further than the mouse study, though. Another common feature of eccentric exercise is that, in the weeks following the exercise, muscle adapts and is protected from damage in a subsequent bout. This phenomenon is called the “repeated bout effect” and was discussed in detail in a previous knowledge translation. 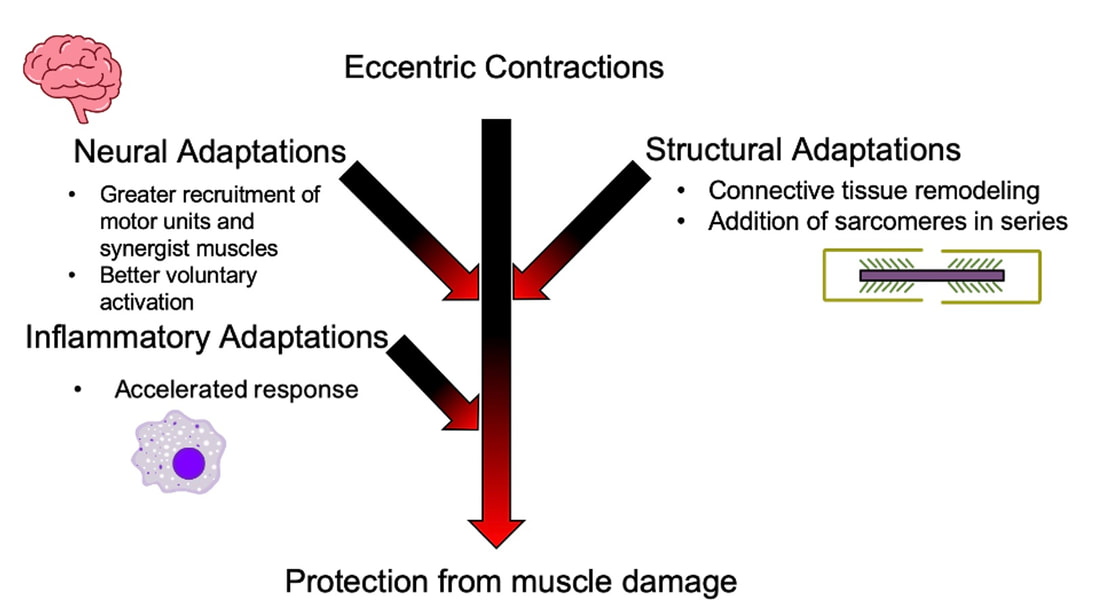 Adapted from thesis by Hess (2017), University of Guelph, depicting the adaptations that occur following an initial bout of eccentric exercise, protecting the muscle from damage in a subsequent bout performed several weeks later. Two weeks after the initial eccentric exercise bout, McBride and Carlsen exposed the rats to a second, identical bout of eccentric exercise. The young rats perfectly demonstrated the repeated bout effect, showing no drop in maximum strength two days post-exercise. The old rats, however, still exhibited a deficit in strength, indicating their muscle did not fully adapt in the 2 weeks between exercise bouts. 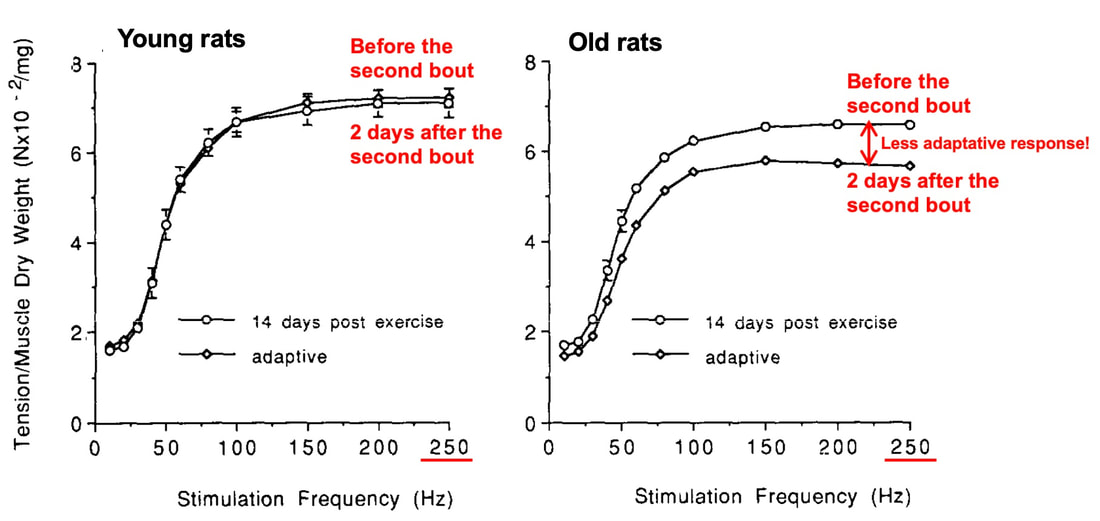 Figure adapted from McBride and Carlsen (1995), Mechanisms of Ageing and Development These rodent studies together have two key takeaways:
But do these results translate to humans? What have studies on humans shown?One of the earliest investigations of susceptibility to damage induced by eccentric exercise in old versus young humans was by Dedrick and Clarkson in 1990. They exposed the forearm flexor muscles of young (~24 years old) and older (~67 years old) women to 24 eccentric contractions.  Like the studies on rodents discussed above, young and older women experienced a similar reduction in isometric strength immediately following the eccentric exercise, and older women took longer to recover. The graph below clearly shows a large difference in maximum isometric strength between the young and older women at 5 days. 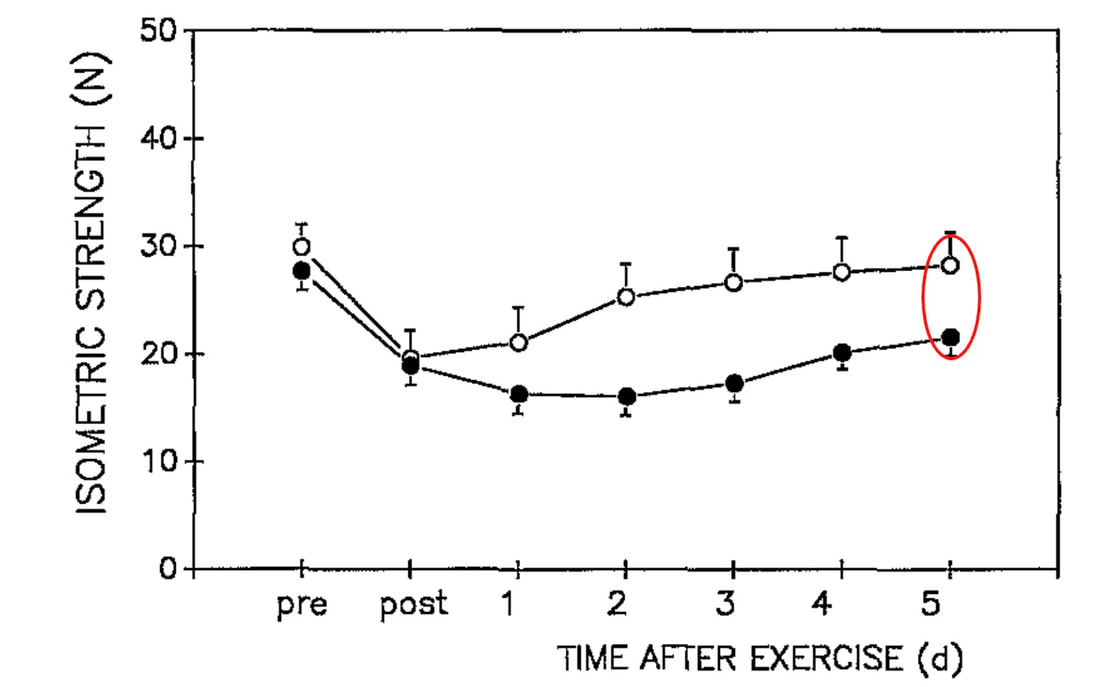 Figure from Dedrick and Clarkson (1990), Journal of Applied Physiology and Occupational Physiology So, there we go! Older humans take longer to recover following eccentric exercise, right? This is where it gets tricky. The next notable studies on this topic were conducted by Lavender and Nosaka in 2006. They subjected the elbow flexor muscles of young (~19 years old) and older (~70 years old) men to six sets of five eccentric contractions. Based on Dedrick and Clarkson’s earlier work, they reasonably expected the effects of eccentric exercise-induced muscle damage to be worse in the older men. They ended up observing the opposite!  Not only did the older men experience less of a reduction in strength following the eccentric exercise, they recovered faster over the course of 10 days. This difference is shown in the graph below, with the black circles representing old and the white squares representing young. 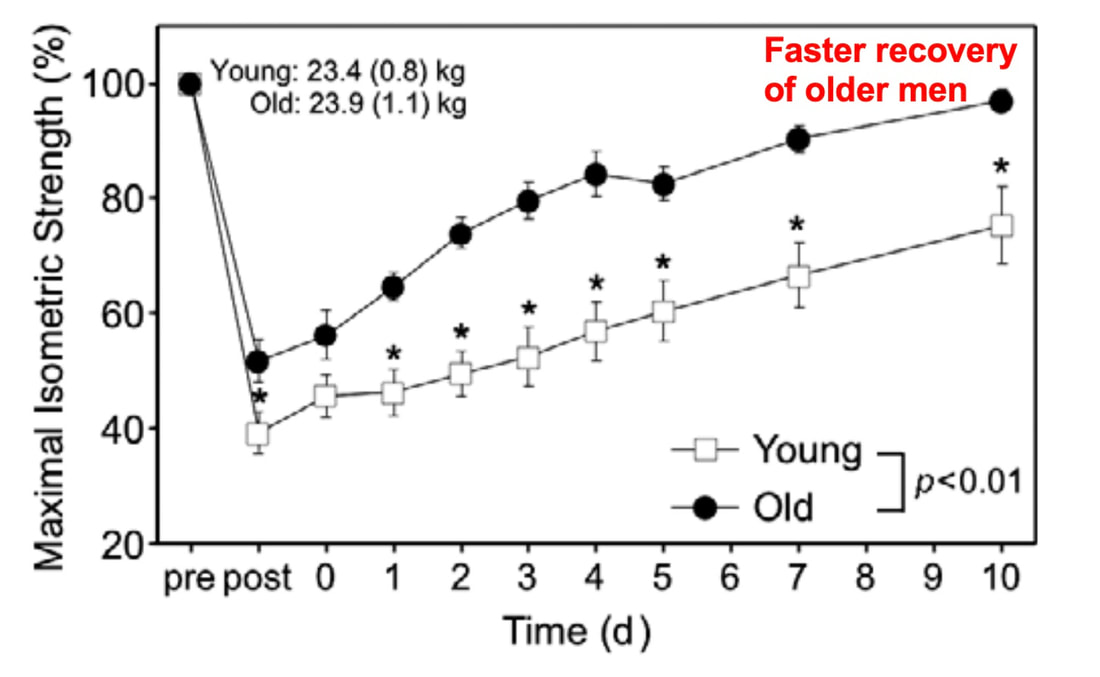 Figure from Lavender and Nosaka (2006), Applied Physiology, Nutrition, and Metabolism In a follow-up, study, however, Lavendar and Nosaka confirmed in humans one of the key take-aways from the rodent studies. After a second bout of eccentric exercise performed 4 weeks later, young men adapted such that their strength recovered sooner. Conversely, older men recovered no different than following the first bout. 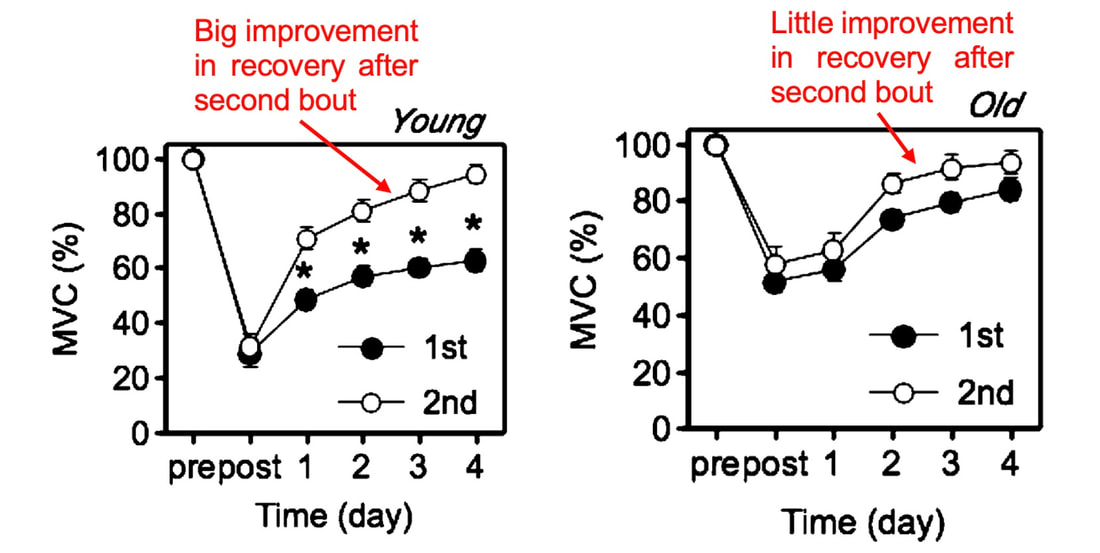 Figure adapted from Lavender and Nosaka (2006), Journal of Applied Physiology. “MVC” represents a measure of maximum isometric strength. For these studies on humans, we should consider the exercise intensity. In Clarkson and Dedrick’s studies, they used maximal eccentric contractions, whereas Lavender and Nosaka’s eccentric contractions equated to about 40% of maximum strength. Perhaps older individuals are more protected from muscle damage in lower intensity eccentric contractions, but experience blunted recovery as intensity increases. Later studies seem to confirm this speculation. Most notably, Chapman and colleagues employed eccentric contractions of the elbow flexors, like Lavender and Nosaka. This time, the eccentric contractions were performed at a maximal intensity and at a faster speed (faster speeds also increase the intensity of eccentric contractions). As shown in the graph below, older men had a severely delayed recovery of strength compared to young men. 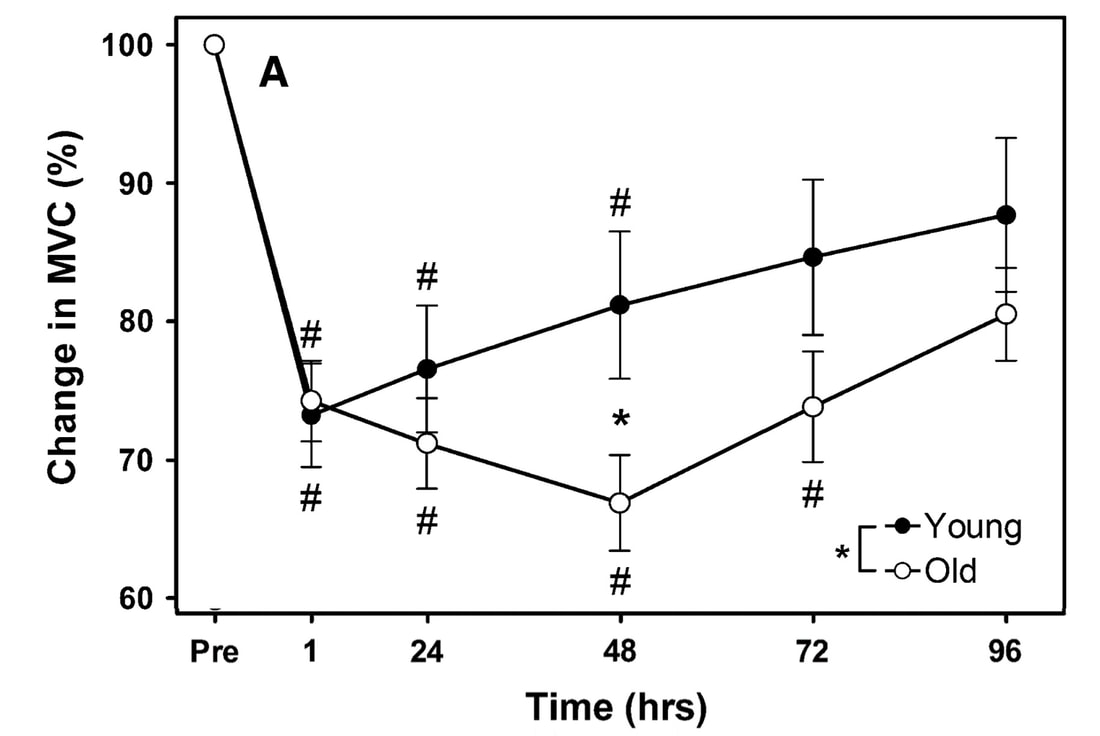 Figure from Chapman et al. (2008), European Journal of Applied Physiology. “MVC” represents a measure of maximum isometric strength. But these results may still very, even with maximal contractions. In the ankle dorsiflexors, Skarabot and colleagues found that older adults had faster recovery following an initial eccentric exercise bout—but it doesn’t stop there! Older adults also adapted better following the first bout such that their strength recovered even sooner following a second bout. 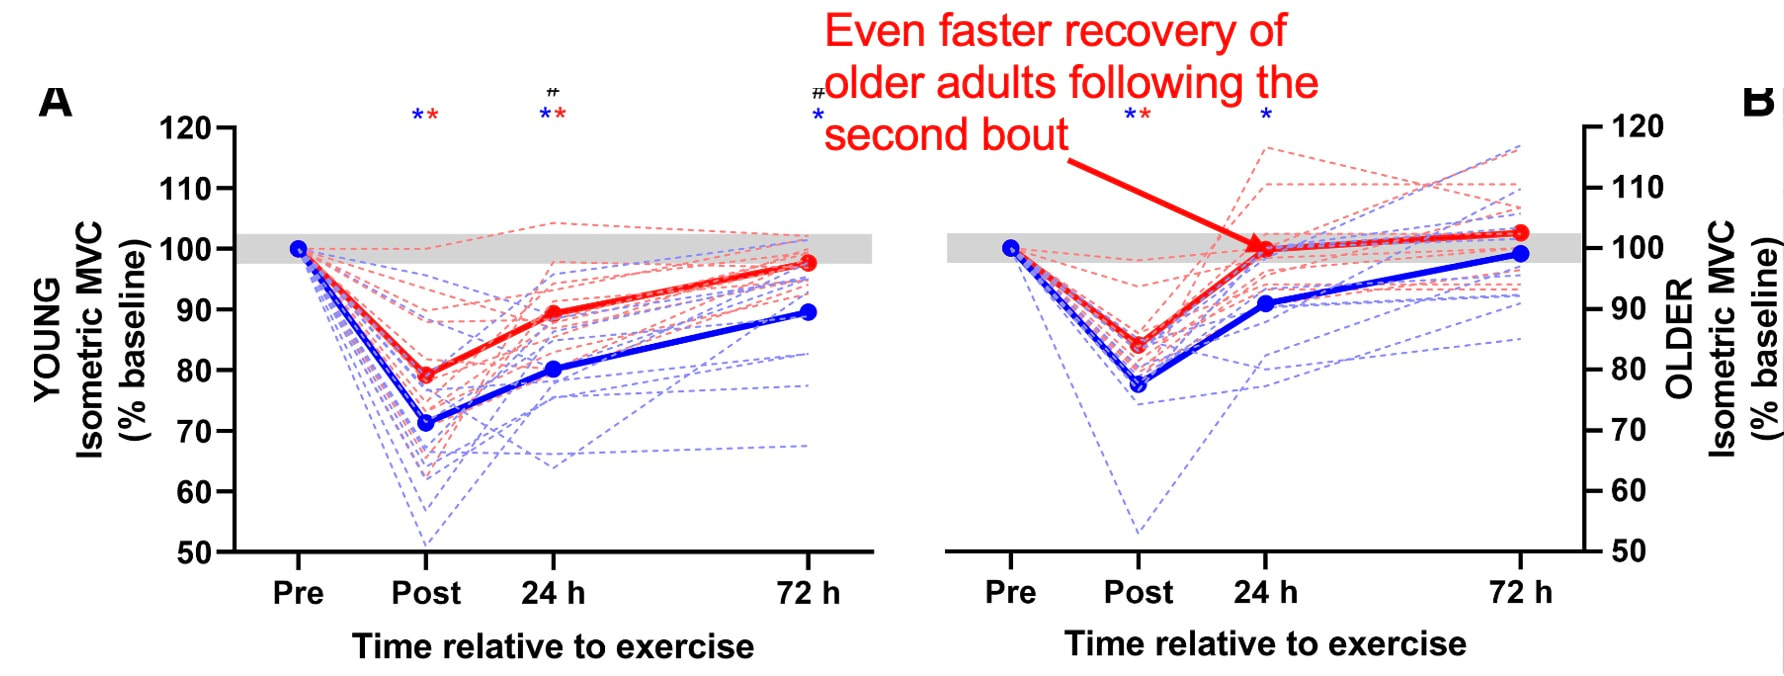 Figure adapted from Skarabot et al. (2019), Journal of Applied Physiology There may be an explanation for Skarabot and colleagues’ conflicting findings, which I will discuss in a moment. For now, even with the conflicting findings among human studies, we can be confident about two points:
Can we mitigate the greater susceptibility to muscle damage in old age?Researchers have offered several explanations regarding the delayed recovery of older compared to young adults. With old age, the molecular processes behind the muscle’s regenerative capacity decline. As a result, adaptations to unaccustomed exercise can take longer, or not occur at all. Muscles also become shorter as they lose mass with age. When performing eccentric contractions, greater damage occurs the further a muscle stretches. Shorter muscles, then, end up stretching further for a given movement, incurring more damage. This greater damage could contribute to the longer recovery time. 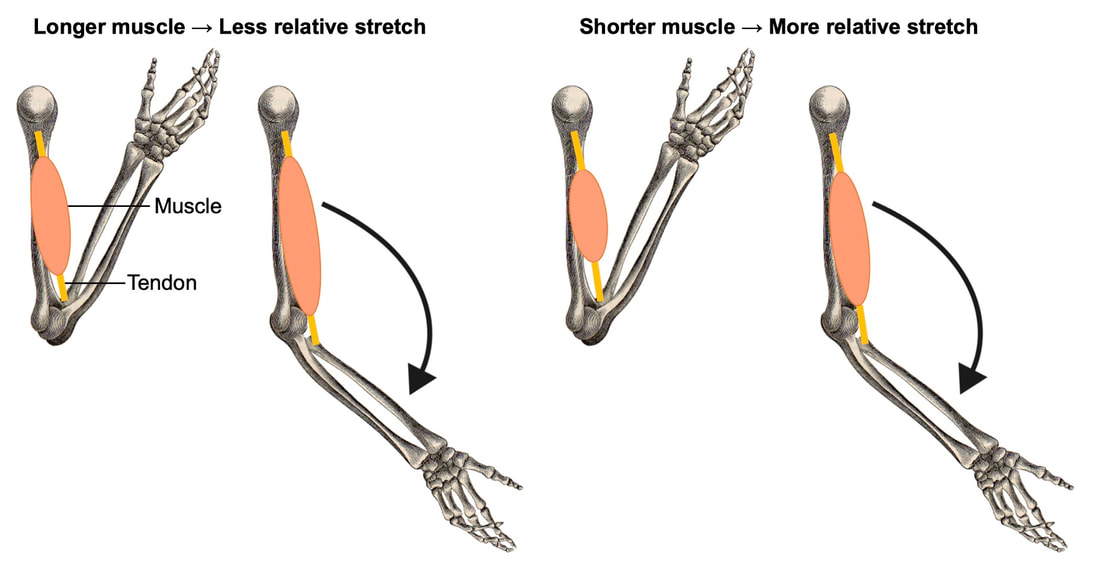 Unsurprisingly, physical activity helps to mitigate the development of weakness following eccentric exercise in old age. Ploutz-Snyder and colleagues subjected the knee extensor muscles of young (~23 years old) and older (~66 years old) women to near-maximal eccentric exercise. The older woman were tested both before and after completing a 12-week resistance training program. 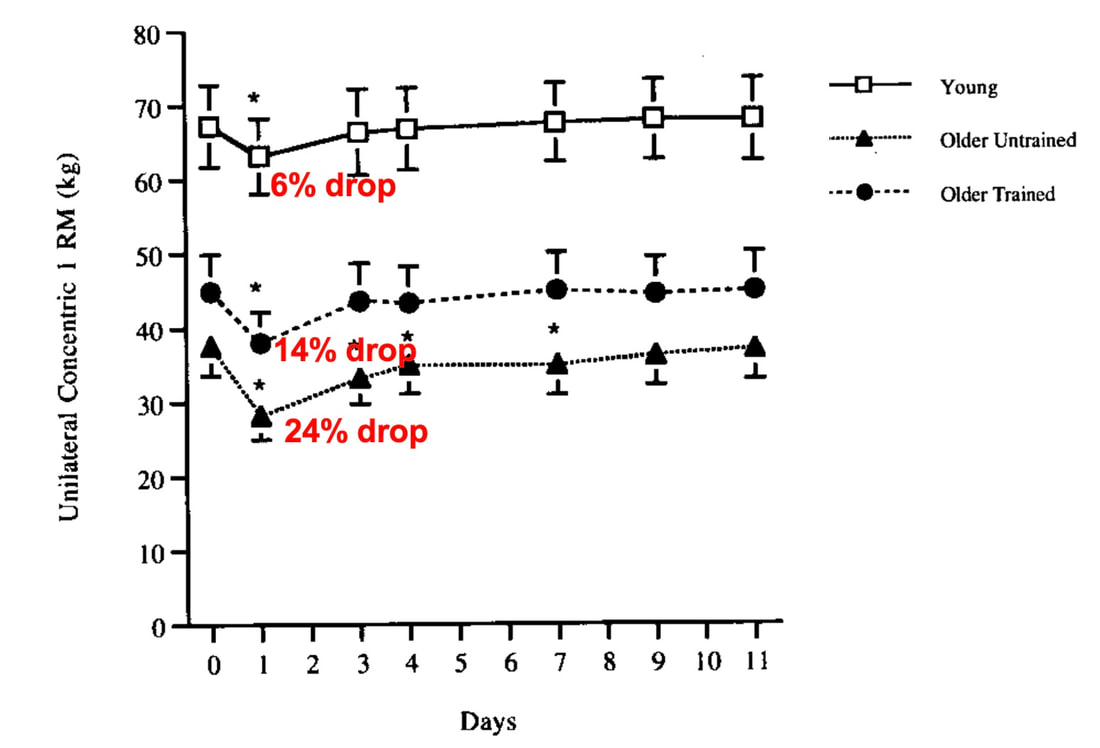 Figure adapted from Ploutz-Snyder et al. (2001), The Journals of Gerontology Series A: Biological Sciences and Medical Sciences When untrained, the older women exhibited a 24% loss of strength following eccentric exercise, compared to only 6% in young women. After resistance training, the older women experienced only a 14% loss of strength following eccentric exercise, recovered sooner, and were statistically no different from the young women. Physical activity may also explain the conflicting findings presented by Skarabot and colleagues above (the graph is shown again below for your convenience). The older adults enrolled in that study reported partaking in on average 330 minutes of moderate to high-intensity physical activity per week. Maybe that particular sample of older adults didn’t exhibit an inability to recover or adapt following eccentric exercise because of their active lifestyles. 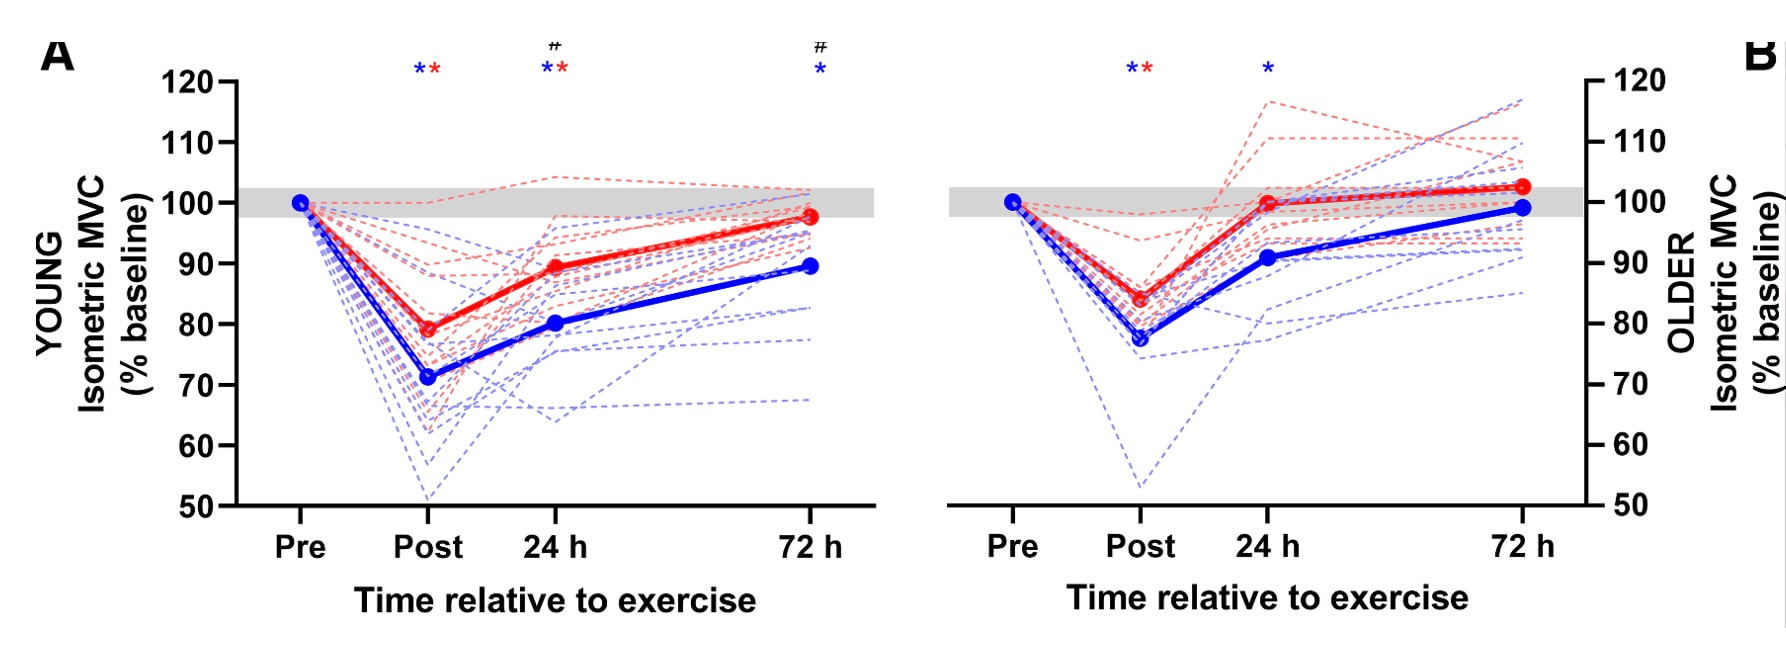 ConclusionSo, does the maintenance of eccentric strength in old age protect older individuals from further exercise-induced muscle damage? Older individuals seem to experience no further weakness following high-intensity eccentric exercise than young individuals, and may even experience less weakness than young if the eccentric exercise is moderate-intensity. Where they differ is in the recovery and the ability to adapt following the exercise, with old showing clear impairments. The good news is these impairments can be mitigated by physical activity—even if physical activity is started when already in old age!  What we’re less certain about is what specifically is going on within the muscle’s structure to drive these differences between young and older adults. Our lab is currently looking into this in groups of old and young rats, so that discussion will have to wait for another day.
References Brooks, S. V., & Faulkner, J. A. (1990). Contraction-induced injury: recovery of skeletal muscles in young and old mice. American Journal of Physiology-Cell Physiology, 258(3), C436–C442. doi:10.1152/ajpcell.1990.258.3.C436 Chapman, D. W., Newton, M., McGuigan, M. R., & Nosaka, K. (2008). Comparison between old and young men for responses to fast velocity maximal lengthening contractions of the elbow flexors. European Journal of Applied Physiology, 104(3), 531–539. doi:10.1007/s00421-008-0806-7 Clarkson PM, Tremblay I. Exercise-induced muscle damage, repair, and adaptation in humans. J Appl Physiol (1985). 1988 Jul;65(1):1-6. doi: 10.1152/jappl.1988.65.1.1. PMID: 3403453. Dedrick, M. E., & Clarkson, P. M. (1990). The effects of eccentric exercise on motor performance in young and older women. European Journal of Applied Physiology and Occupational Physiology, 60(3), 183–186. doi:10.1007/bf00839156 Lavender, A. P., & Nosaka, K. (2006). Comparison between old and young men for changes in makers of muscle damage following voluntary eccentric exercise of the elbow flexors. Applied Physiology, Nutrition, and Metabolism, 31(3), 218–225. doi:10.1139/h05-028 Lavender, A. P., & Nosaka, K. (2006). Responses of old men to repeated bouts of eccentric exercise of the elbow flexors in comparison with young men. European Journal of Applied Physiology, 97(5), 619–626. doi:10.1007/s00421-006-0224-7 McBride, T. A., Gorin, F. A., & Carlsen, R. C. (1995). Prolonged recovery and reduced adaptation in aged rat muscle following eccentric exercise. Mechanisms of Ageing and Development, 83(3), 185–200. doi:10.1016/0047-6374(95)01629-e Ploutz-Snyder, L. L., Giamis, E. L., Formikell, M., & Rosenbaum, A. E. (2001). Resistance Training Reduces Susceptibility to Eccentric Exercise-Induced Muscle Dysfunction in Older Women. The Journals of Gerontology Series A: Biological Sciences and Medical Sciences, 56(9), B384–B390. doi:10.1093/gerona/56.9.b384 Škarabot, J., Ansdell, P., Temesi, J., Howatson, G., Goodall, S., & Durbaba, R. (2019). Neurophysiological responses and adaptation following repeated bouts of maximal lengthening contractions in young and older adults. Journal of Applied Physiology. doi:10.1152/japplphysiol.00494.2019 Can we scale muscle function from the single fibre to the joint level? (Insights from our lab)5/13/2023 By Avery Hinks In our lab, we measure muscle function in single fibres all the way up to whole groups of muscles producing movement together. We have a single fibre testing system in which we test fibres dissected from rodent muscles or human muscle biopsies. Our whole-muscle system allows us to test a whole dissected rodent muscle. On the largest scale, we can sit human participants in a chair called a “dynamometer” and instruct them to kick against a lever. 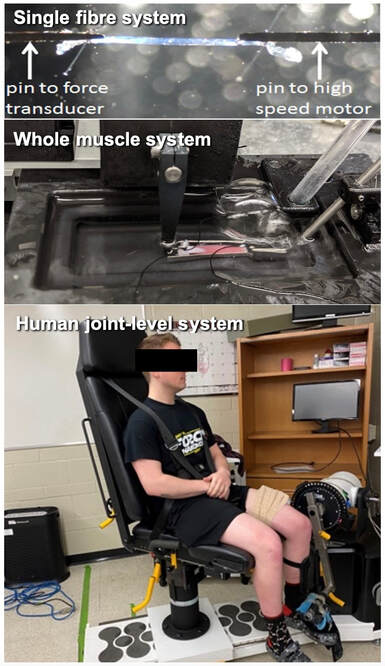 At all scales, we perform similar assessments. These include maximum strength, maximum speed, how powerful a movement is—or just about any fundamental property of muscle function! We can do this because muscle structure is a predictable hierarchy. A whole muscle is made of many muscle fascicles, which are each made of many muscle fibres, which are each made of many myofibrils, which are each made of many sarcomeres aligned in series. 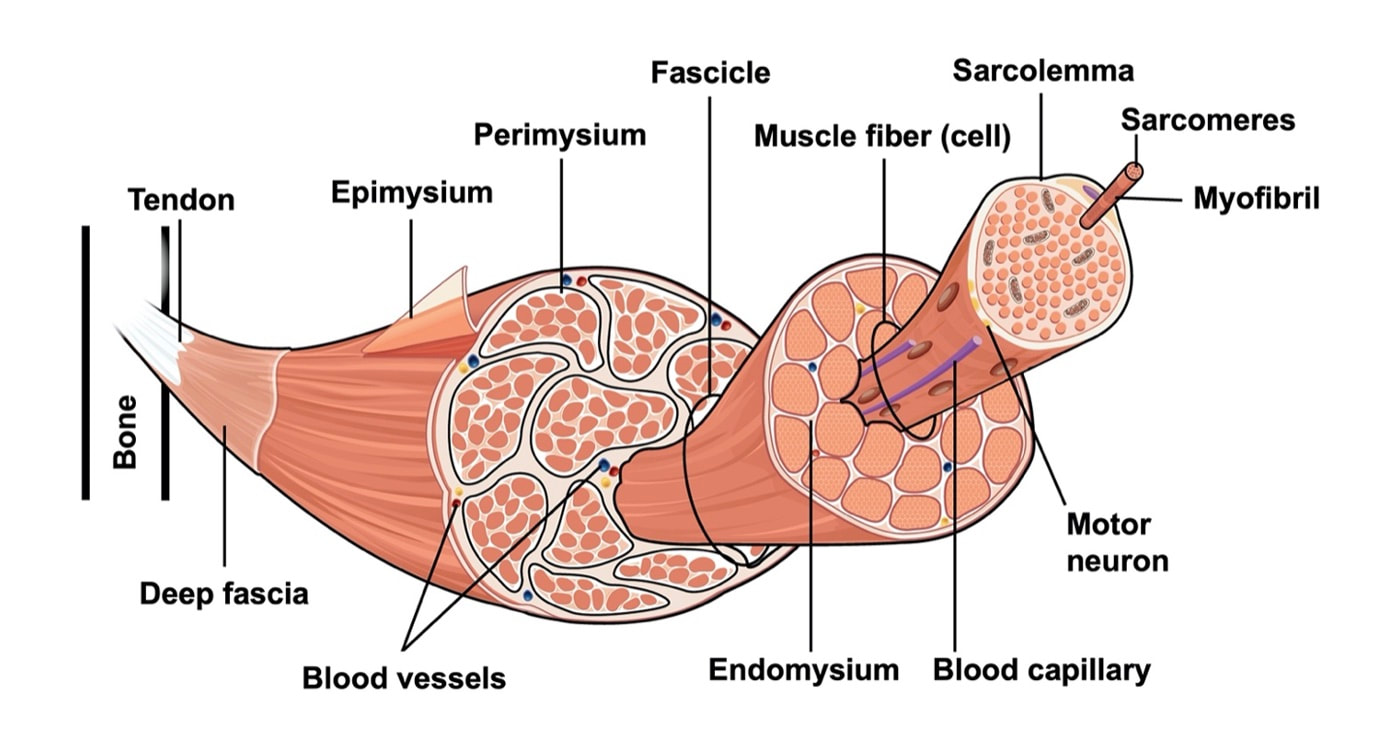 Even with this hierarchy in mind, however, it might be hard to believe that what looks like a piece of a translucent noodle (that being a muscle fibre) functions the same as an entire group of muscles contracting to kick against a lever. 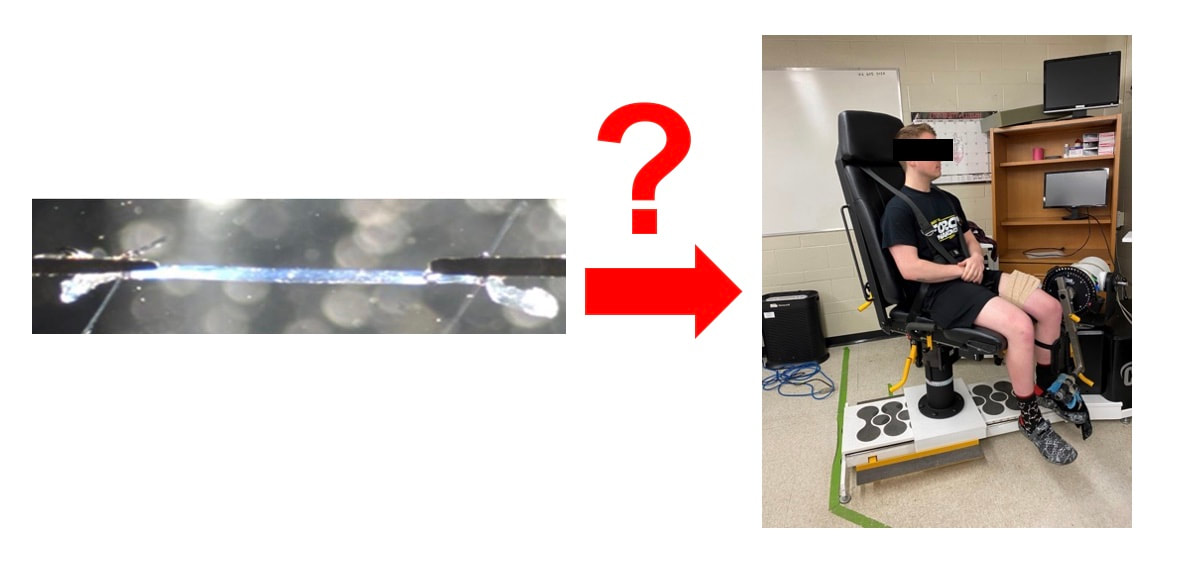 And you’d be right to be skeptical! While the same biomechanical properties exist at all scales of muscle, there is rarely a one-to-one relationship from the single fibre to the whole muscle, and especially to the joint level. Why would this be the case, even when taking these measures within the same subject? In today’s knowledge translation, I will outline a few key considerations. Synergist muscles and fibre types When we produce any movement, it is rarely the result of just one muscle contracting. Kicking, for example, requires a coordinated effort among the four quadriceps muscles: vastus lateralis, rectus femoris, vastus intermedius, and vastus medialis. 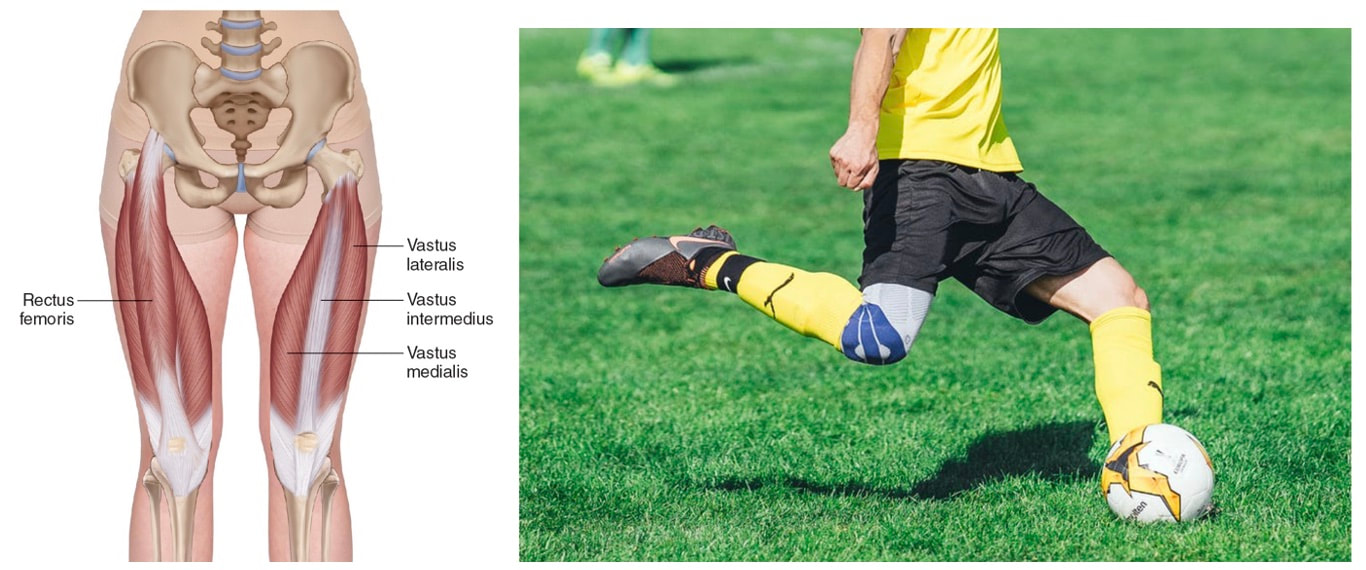 Even with this in mind, when attempting to equate muscle function from the single fibre to the joint level, we often focus solely on the vastus lateralis, ignoring the other quadriceps. But the vastus lateralis is the largest of the quadriceps muscles, and the easiest (and safest) to biopsy for single fibre experiments, so how much can we ignore those other muscles when comparing across scales? A study from our lab by Dalton and colleagues offers insight. In 8 young and 8 older men, they assessed rate of force development (a measure of how quickly one can develop maximum strength) in the whole quadriceps muscle group on a dynamometer and in vastus lateralis single fibres. In the figure below, the circled R^2 values on the larger graph correspond to the relationships indicated by red arrows on the smaller graphs. From these graphs, it is clear that single fibre rate of force development only related to joint-level rate of force development in slow-type fibres in old men. No other relationships existed between single fibre and joint-level rate of force development. 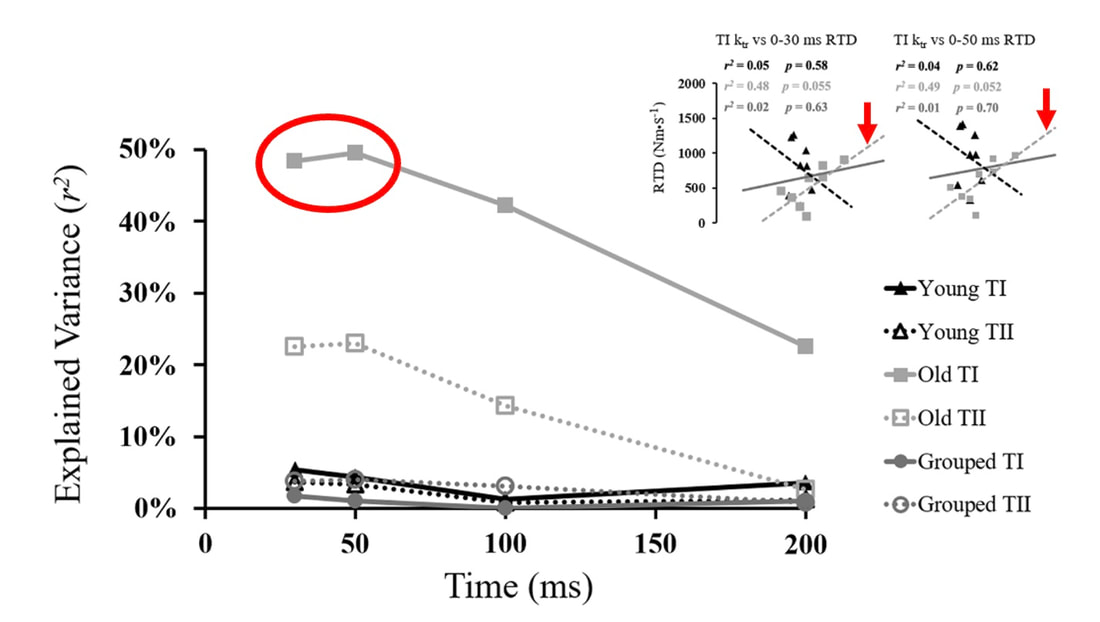 Figure from Dalton et al. (2023), European Journal of Applied Physiology. TI = slow-type fibres. TII = fast-type fibres. Does this mean that single muscle fibre function and joint-level function are independent of one another? Definitely not. Based on the hierarchy of muscle structure, there would be no muscle without those fibres. What these graphs tell us is synergist muscles and other confounding factors discussed below provide enough of a disconnect between small-scale and large-scale muscle function that observing a clear relationship experimentally is difficult. 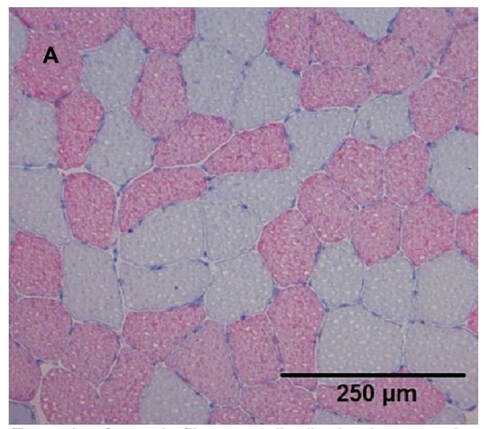 Example of muscle fibre type distribution in a muscle cross-section. Slow-type fibres appear grey while fast-type fibres appear red. Figure from Winkler et al. (2019), Frontiers in Physiology. The above graphs also raise a further consideration when going from the single fibre to the joint level: muscle fibre type. Most muscles consist of both “fast-twitch” and “slow-twitch” types of muscle fibres, the former being faster and stronger. In the above study, about 8 fibres were tested per person, but a whole vastus lateralis could contain hundreds of thousands of fibres. Perhaps 8 isn’t enough to represent the whole muscle, much less the whole joint, at the single fibre level. But what is enough? At the moment, our answer is as many as possible. We must also consider how time-consuming single fibre experiments can be, and the comfort of participants in giving multiple biopsies. Tendons and the extracellular matrix Muscles attach to bones, and as a muscle contracts, it draws two bones closer together, producing movement about a joint. 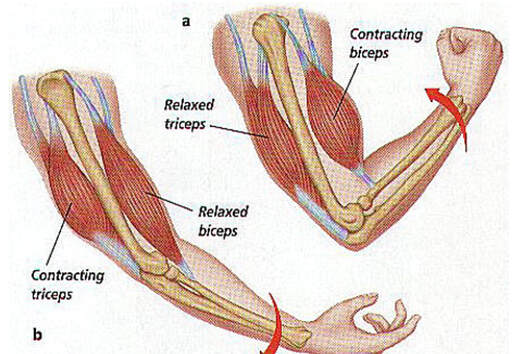 Figure from: https://arts3science.wordpress.com/humanbeing/locomotor/musclesmovebones/ But as you can see in the picture above, muscles do not attach directly to bone. Rather, muscle attaches to something that attaches to bone. That something is called a tendon. 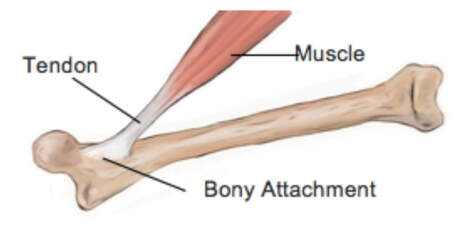 When a muscle contracts, it first pulls on the tendon, which then pulls on the bone it’s attached to, producing movement. If tendons were stiff like ropes, there would be no delay between when the muscle contracts and when the tendon pulls the bone. However, tendons are more like elastics, and undergo some initial stretch when muscles pull on them before that pull is transmitted to bone. Think of it like pulling a 10-pound weight with an elastic band—the weight will move eventually, but only after the elastic band has stretched a certain amount. 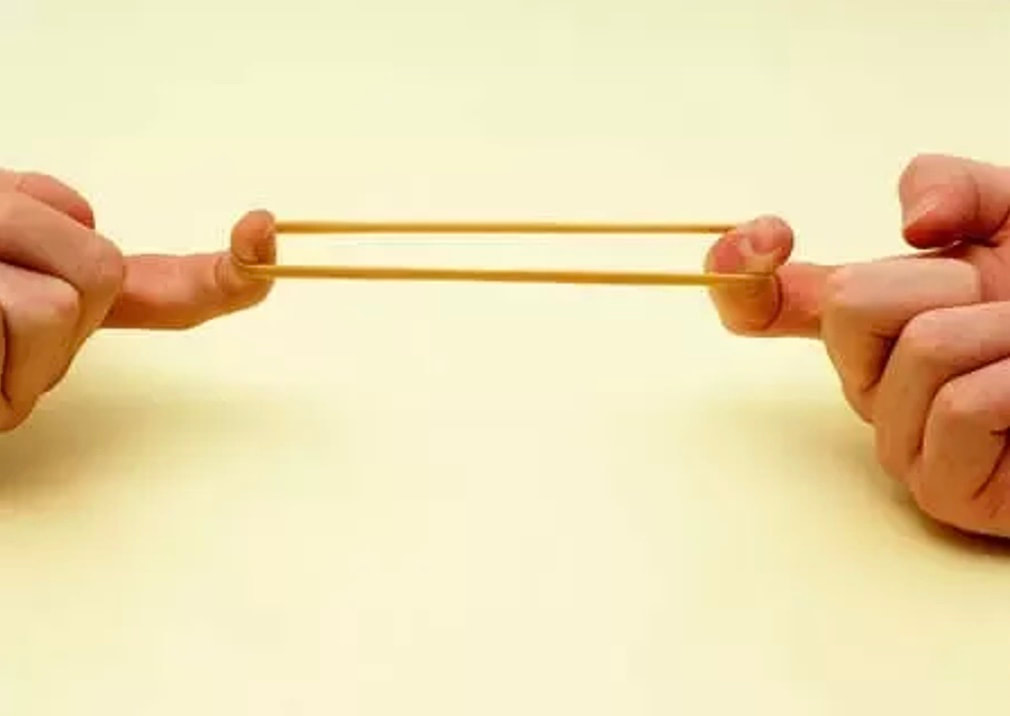 Tendon stiffness varies from person to person, too. If a tendon is stiffer, there can be a closer relationship between shortening of the muscle and movement at the joint. If a tendon is more compliant (in other words, less stiff), there may be more initial muscle shortening before the joint moves. The same applies during muscle stretch: with a more compliant tendon, more of the stretch might go to the tendon, alleviating the amount of tension on the muscle itself.  When we perform experiments on just one muscle, we can eliminate the tendon as a factor in muscle function. In our lab, this is only possible in rodents, after a muscle is dissected out, although recently labs in the United States also did this in humans intra-operatively. In the image below, we tied off the rat soleus muscle at the junctions where tendon and muscle meet, isolating the muscle from the tendons. 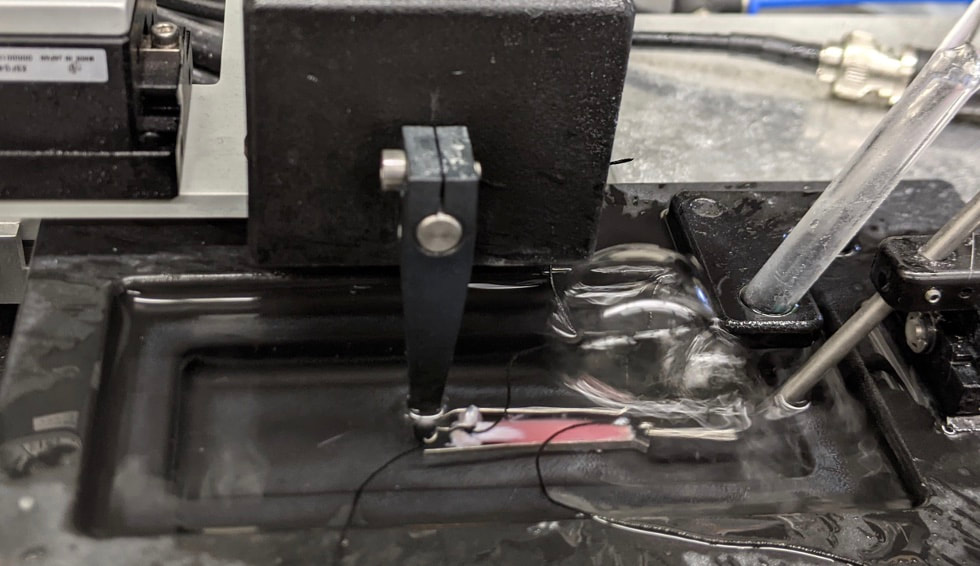 What whole-muscle testing does not eliminate is connective tissue. Sheaths of connective tissue wrap around each scale of muscle discussed earlier. A sheath called the “epimysium” wraps around the whole muscle, a sheath called the “perimysium” wraps around each fascicle, and a sheath called the “endomysium” wraps around each fibre. Each of these sheaths also connect to one another, building a whole network called the “extracellular matrix.” 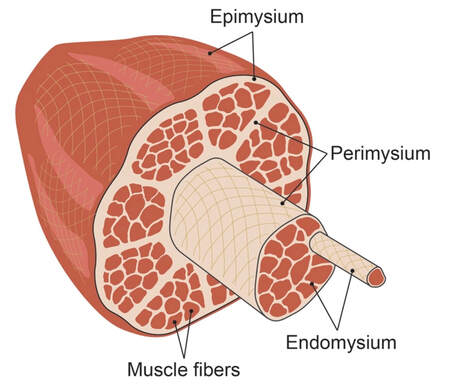 Similar to the tendon, these sheaths of connective tissue transmit force when a muscle contracts—but between each muscle fibre and fascicle, and also to the tendon. If somebody has stiffer connective tissue, that will produce more tension in the muscle during stretch, even if the tendon has been removed from the equation. There are no sheaths of this connective tissue below the level of the single fibre. Therefore, single fibres allow us to assess muscle function without having to consider the impact of connective tissue. 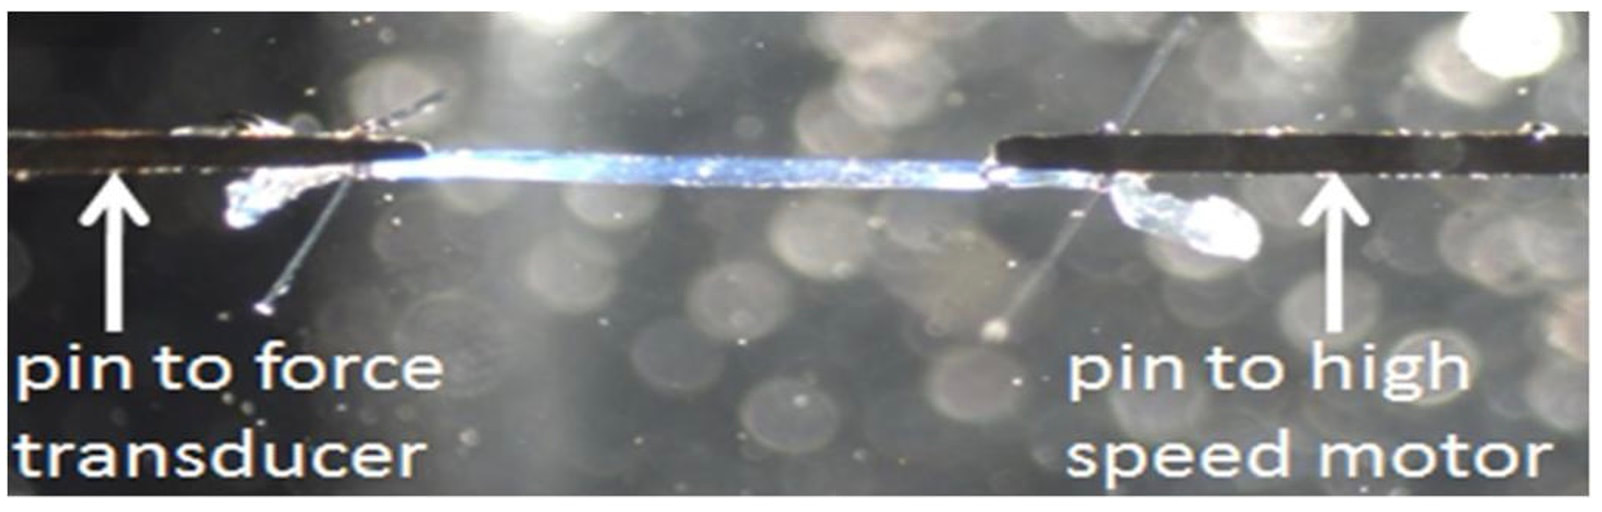 An excellent example of how connective tissue impacts muscle function from the fibre to the whole muscle can be found in a systematic review by Binder-Markey and colleagues. They compiled results across several studies that investigated the passive force-length relationship of muscle. The passive force-length relationship dictates, understandably, that as a muscle stretches, its tension increases. The graphs below show that this increase in tension becomes steeper when going from a single fibre to a fibre bundle to a whole muscle. Connective tissue is largely behind the greater steepness in this relationship when going from smaller to larger scales. 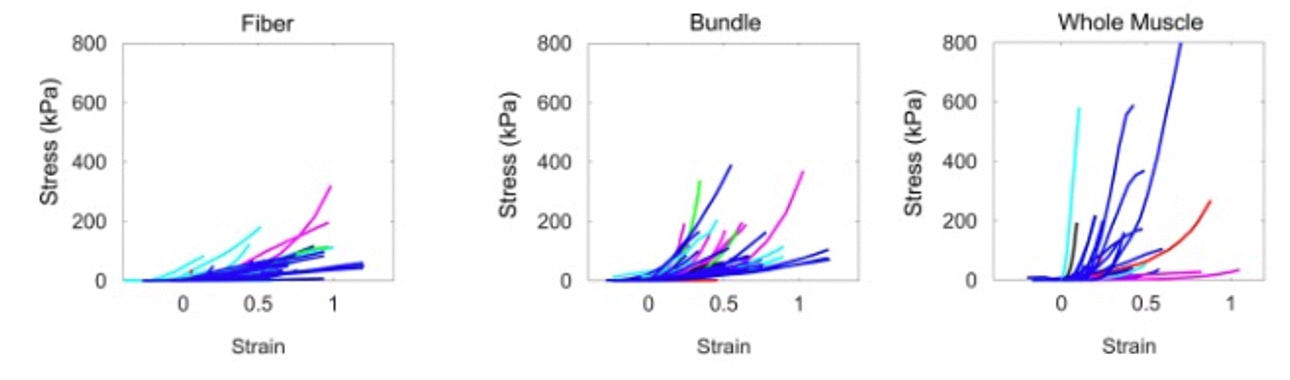 Figure from Binder-Markey et al. (2021), Journal of Biomechanics. Neural contribution to force production The primary basis for muscle force production exists in the “sliding filament theory.” When you activate a muscle, proteins called actin and myosin bind together to pull the Z-disc edges of a sarcomere (the smallest unit of a muscle) closer together. This process of actin and myosin binding dictates strength, speed, and power across all scales of muscle. There is another contributor to force production, though, that exists only in joint-level experiments: the brain.  In our experiments on biopsied single muscle fibres or whole muscles dissected from a rat, we control every aspect of the muscle’s activation ourselves from a computer. When a participant sits in our dynamometer chair, however, and we tell them to kick against a lever, they control their muscle activation themselves. 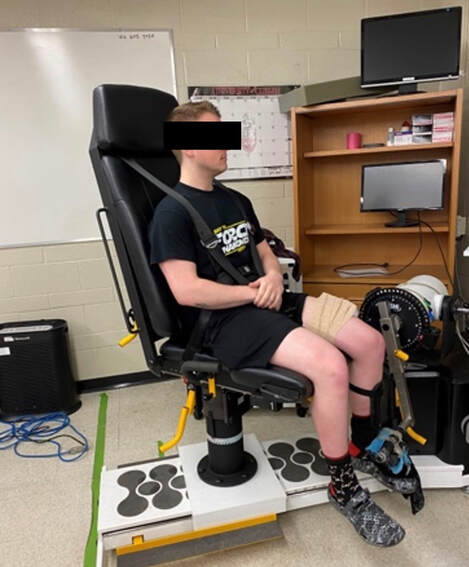 Sleep, stress, drugs, and numerous other factors can influence our brain’s performance. To activate a muscle, the brain sends a signal down the spinal cord, then along a nerve that connects directly to the muscle. These factors, in turn, can influence our muscle performance as well.  Going a step further, the path from the brain to the muscle is not straightforward. Along the way, intersecting pathways can inhibit or further facilitate the signal from the brain. These inputs exist mainly at the brain and the spinal cord, and include inputs from pain sensors, sensors in the skin and joints, and sensors within the muscle being activated and other muscles. 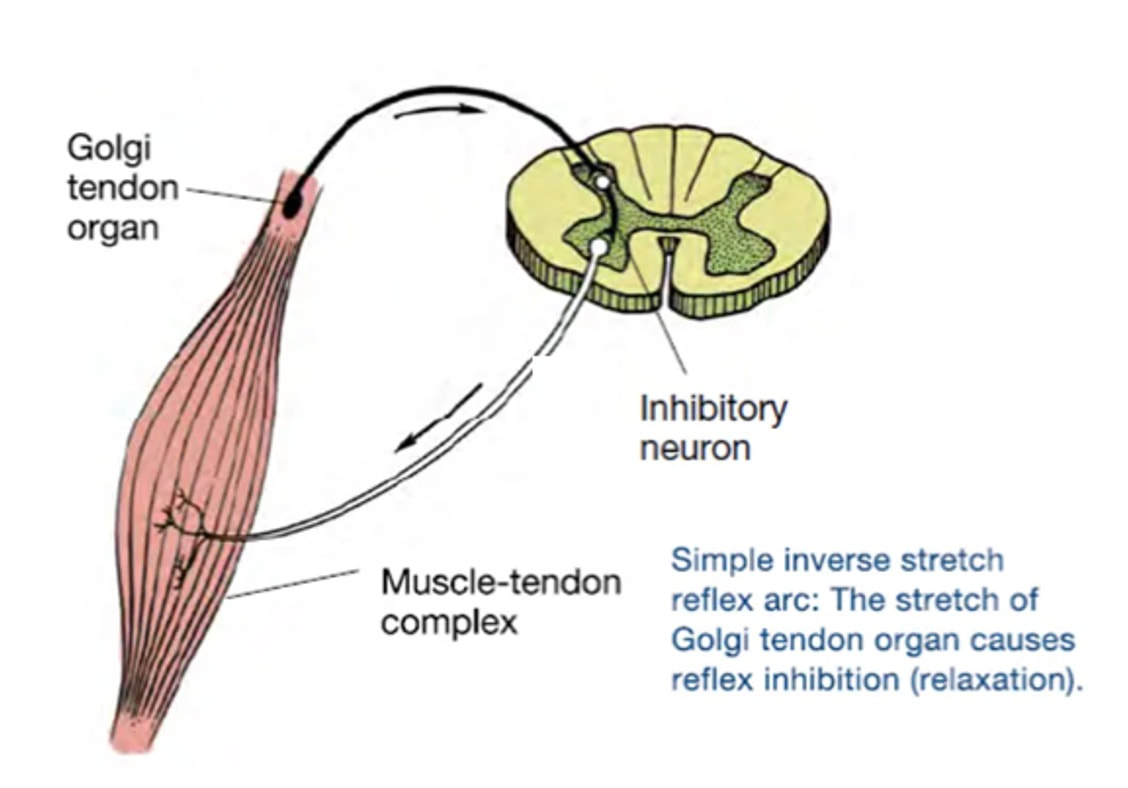 One example we’ve encountered in our lab is input from the “Golgi tendon organ” (GTO for short), a sensor that exists in tendons. The GTO senses stretch. When a tendon stretches past a certain point, the GTO sends a signal to the spinal cord to inhibit force production to protect the muscle. When we actively stretch a muscle, we can subsequently enhance its static force-producing ability. This phenomenon is called “residual force enhancement,” and is described further in a previous knowledge translation. We have observed residual force enhancement at every scale of muscle from the single fibre to the joint level. However, at the joint level, we sometimes encounter “non-responders,” people who do not exhibit residual force enhancement. By contrast, we ALWAYS see residual force enhancement in single fibres and dissected muscles. 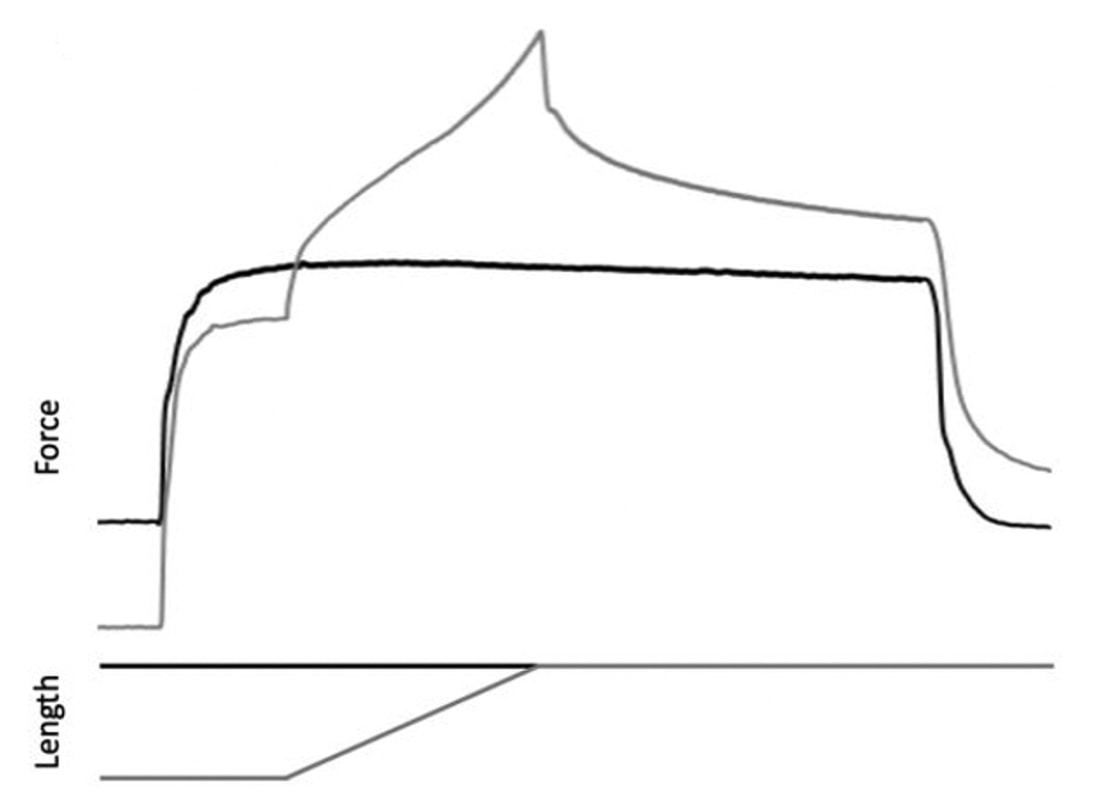 Figure from Chen et al. (2020), Journal of Experimental Biology, showing residual force enhancement following active stretch (grey) compared to a reference isometric contraction (black) in dissected rat muscle. A study from our lab by Contento and colleagues observed a greater GTO reflex during residual force enhancement (“rTE” in the graphs below) compared to a reference contraction not preceded by active stretch (“ISO” in the graphs below). The GTO is far removed from the equation in our single fibre and whole-muscle experiments. Therefore, the non-responders we encounter at the joint level may be caused by the GTO’s inhibitory input or other inhibitory inputs at the spinal cord. 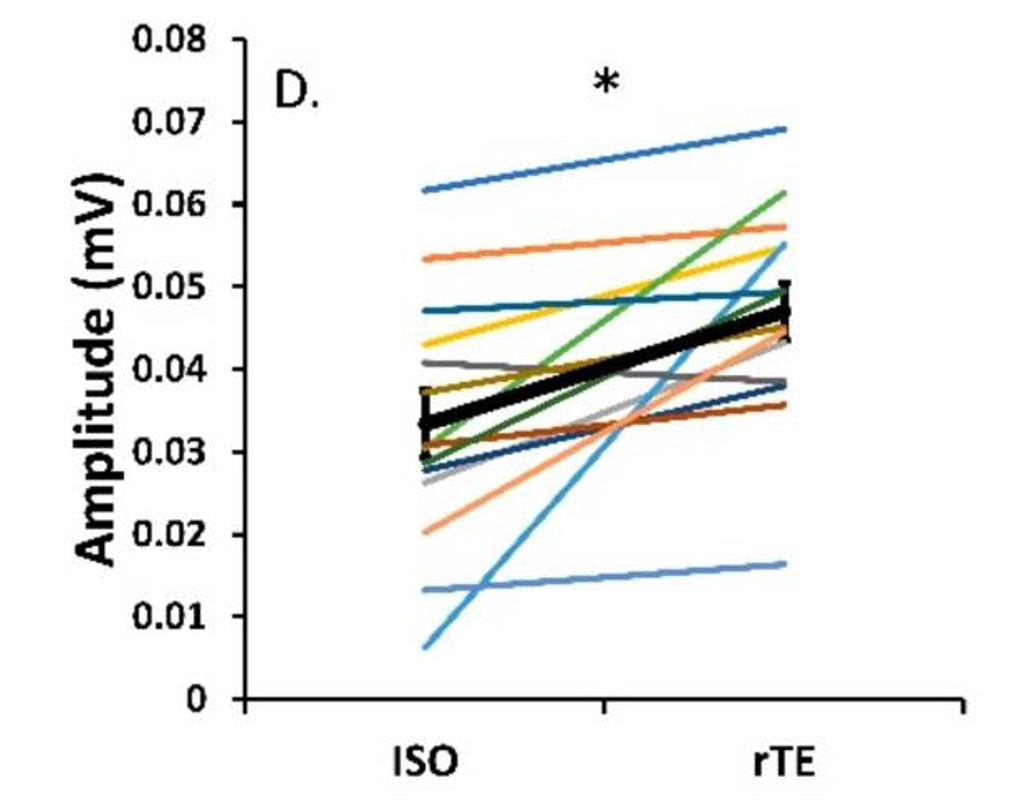 Figure from Contento et al. (2020), Brain Sciences. ConclusionThe highly organized hierarchy of muscle structure makes equating muscle function from smaller to larger scales appealing. However, as we move to larger scales, we must increasingly consider confounding factors of tendons and the extracellular matrix, other muscles acting in synergy with the muscle of interest, and neural contributions to force production. So far, we have observed some instances of relationships between single fibre and joint-level function. Such observations may be easier to produce as we further refine techniques to account for these factors when attempting to match muscle function across scales. 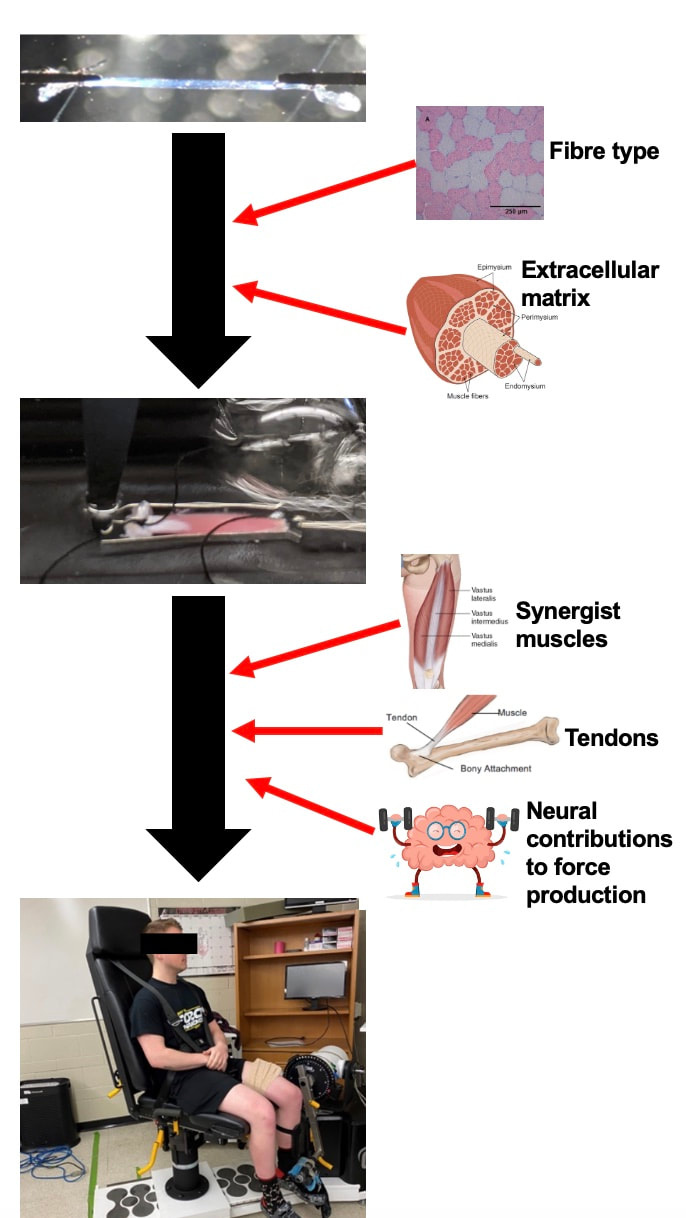 References
Binder-Markey BI, Sychowski D, Lieber RL. Systematic review of skeletal muscle passive mechanics experimental methodology. J Biomech. 2021 Dec 2;129:110839. doi: 10.1016/j.jbiomech.2021.110839. Epub 2021 Oct 26. PMID: 34736082; PMCID: PMC8671228. Binder-Markey BI, Persad LS, Shin AY, Litchy WJ, Kaufman KR, Lieber RL. Direct intraoperative measurement of isometric contractile properties in living human muscle. J Physiol. 2023 Mar 11. doi: 10.1113/JP284092. Epub ahead of print. PMID: 36905200. Chen J, Mashouri P, Fontyn S, Valvano M, Elliott-Mohamed S, Noonan AM, Brown SHM, Power GA. The influence of training-induced sarcomerogenesis on the history dependence of force. J Exp Biol. 2020 Aug 13;223(Pt 15):jeb218776. doi: 10.1242/jeb.218776. PMID: 32561632. Contento VS, Dalton BH, Power GA. The Inhibitory Tendon-Evoked Reflex Is Increased in the Torque-Enhanced State Following Active Lengthening Compared to a Purely Isometric Contraction. Brain Sci. 2019 Dec 23;10(1):13. doi: 10.3390/brainsci10010013. PMID: 31878094; PMCID: PMC7016668. Dalton BE, Mazara N, Debenham MIB, Zwambag DP, Noonan AM, Weersink E, Brown SHM, Power GA. The relationship between single muscle fibre and voluntary rate of force development in young and old males. Eur J Appl Physiol. 2023 Apr;123(4):821-832. doi: 10.1007/s00421-022-05111-1. Epub 2022 Dec 9. PMID: 36484861. Winkler T, Mersmann F, von Roth P, Dietrich R, Bierbaum S, Arampatzis A. Development of a Non-invasive Methodology for the Assessment of Muscle Fibre Composition. Front Physiol. 2019 Mar 11;10:174. doi: 10.3389/fphys.2019.00174. PMID: 30914961; PMCID: PMC6421337. By Avery Hinks For the past few weeks, it has seemed that every time I open Twitter, I see news of a new AI tool. I feel like I’ve been living in The Matrix, only with less cool sunglasses and leather trench coats. Since I’m not Keanu Reeves, this overwhelmed me at first. However, I’ve begun to embrace the reality that is a rapidly evolving landscape of AI tools. As graduate students, we have a diverse list of tasks we must complete daily. If we’re not performing experiments, we’re analyzing data. If we’re not analyzing data, we’re writing. If we’re not writing, we’re procrastinating from writing by making a presentation or marking undergraduate student assignments. If we’re not doing any of these things, we might be wondering what we want to do with our lives and why we are here. Or we’re taking a nap, intentional or not. The above paragraph is an exaggeration, and it’s probably also an exaggeration to say that AI can solve all those problems. What I can say is I’ve found several ways that AI can enhance both my experience and the quality of my work as a graduate student. Here are five examples!  1. Coding Back in December, I wrote this knowledge translation about how to fit data to a curve in Excel. I knew curve-fitting could be done using a coding software such as Python, however, learning how to code seemed daunting, and I didn’t know where to start. Despite being time-consuming, the Excel method was familiar, so I stayed inside my comfort zone. Then, last week, I asked ChatGPT to design me a code to fit force and velocity data to Hill’s force-velocity equation. Within half an hour, I had a functional code. Here’s a video of it in action, using some of my preliminary data from the rat plantar flexor muscles: https://drive.google.com/file/d/1KBH1onWo8F2OKX4RyRLXE_MMYdvAGWux/view?usp=sharing As you can see, compared to the Excel method, I don’t have to spend an excessive amount of time copying and pasting data, and I don’t have to overload an Excel file with numerous curve-fitting graphs. This Python output gives me everything I need with a single click: the a and b coefficients, the maximum force and velocity, the curvature of the relationship, peak power, and the R^2 value. The curve-fitting itself is not the best part about this example, though. The initial code that ChatGPT gave me was functional, but lacking creativity. I originally had to input the Excel file path into the code itself, rather than having a window appear to select the Excel file as shown in the video. The graph also initially didn’t include power or a measurement of the predicted maximum velocity. By going back-and-forth with ChatGPT, and being specific about what I needed, I was able to add these capabilities. In some cases, I was even able to pick up on the coding language and refine the code myself. 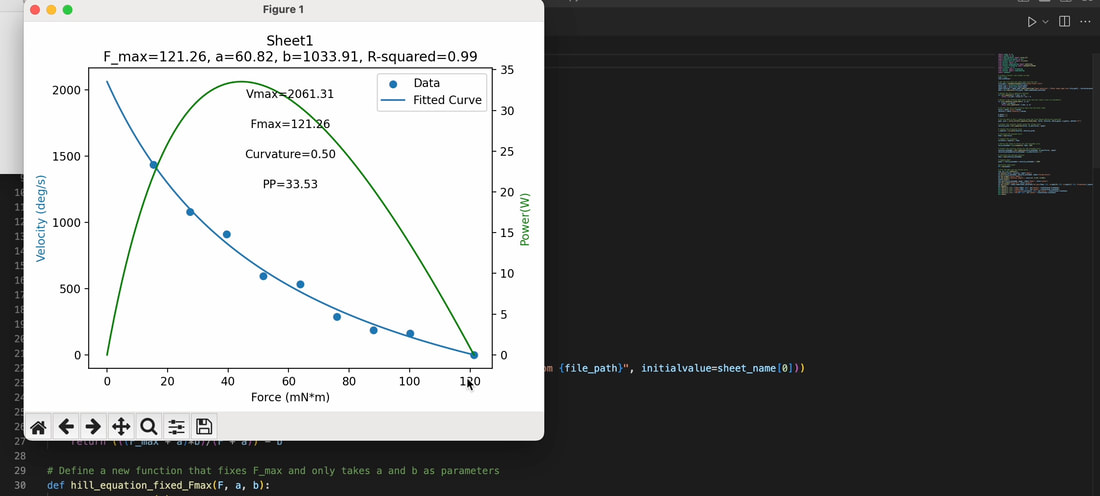 In the past, I have found that my research area is so specific, it is hard to find any help online for how I can streamline aspects of my data analysis. AI has helped me finally feel confident that I can use code to accomplish some of my very specific tasks! 2. Visually appealing images for presentationsContinuing on the point above about my research being so specific that it’s hard to find help with certain aspects of it online, the same applies for finding images related to my research. This becomes especially annoying when it’s time to put together a PowerPoint presentation for a conference talk. If I want an eye-catching opening slide, I either need to take a good photo of my research myself (and when you’re in the heat of completing an experiment, that’s not always possible) or hope I can find an image online that relates close enough to what I want to show. AI image-generating platforms like Midjourney and Bing have provided the ability to create any photorealistic image I want from scratch. I was shocked at how well this worked. Below are some examples. For my master’s project, I put weighted vests on rats and had them run on a treadmill. Many of the photos I took of the rats with their weighted vests on looked ridiculous. I gave Bing Image Generator the prompt “A white rat wearing a weighted vest” and ended up with something more professional:  I do less research in our human lab than I used to, but if I ever present one of our lab’s human studies again, and it includes electromyographic data, I will likely use this on the title slide (“Electromyographic activity recording on computer”):  A significant portion of my current research involves measuring sarcomere lengths using a laser diffraction system. With the prompt “Measurement of sarcomere lengths by laser diffraction on a computer,” Bing Image Generator gave me an image that makes laser diffraction look way more interesting than I could ever make it look:  Some of my colleagues recently completed a study in which mice performed high-intensity interval training on a treadmill. I wanted to see if Bing Image Generator could make anything good for them (“Lab mouse running on a treadmill”):  My colleagues also noted that some of their mice looked a little chunky at the start of the training period, so I adjusted the prompt accordingly (“Fat lab mouse running on a treadmill”):  It’s not perfect, though. When I tried “Man seated in a Biodex dynamometer,” the result was horrifying. This would be a case where it’s better to just take a photo myself.  Still, I’m excited to see what images AI can help me create for future presentations! 3. Paper summaries One limitation of ChatGPT is that the free version will not read more than 3000 words. This means you could not, for example, feed ChatGPT an entire journal article and ask it to summarize that article. Additionally, if you ask ChatGPT to summarize [enter article title here], it will give you a summary that seems accurate on the surface, but is completely made up.  In the above example, several pieces of information provided by ChatGPT are incorrect. For example, the study included 13 participants (not 21) and 8 weeks of training (not 6). Training at a short muscle length also did not alter the history dependence of force at all, contrary to what ChatGPT suggested. (I know this because I wrote that paper). Thankfully, there are other AI tools that are designed specifically for summarizing papers. Similar to above, I used papers I authored to test this out. Casper is a Google Chrome extension that anyone can access. After adding it to your Google Chrome, all you have to do is open the webpage for the article you wish to summarize, then click the Casper icon.  After that, Casper gives a general summary of the paper. This summary would not function as a replacement for reading the paper. However, if you’ve already read the paper once or twice, a summary like this would be useful for jogging your memory on the topics covered. An example of when you might need this could be when studying for your comprehensive exams. Casper’s capabilities don’t stop there. After the initial summary is generated, you can scroll down, then click a three-dots icon. Options will appear that prompt Casper to elaborate, summarize more concisely, brainstorm ideas based on the content of the paper, suggest actions, or explain the paper like you’re a 5-year-old.  The two that I’ve found most impressive are the “Elaborate” and “Suggest actions” prompts. “Elaborate” may be useful if you need more help jogging your memory on the specific concepts covered in the paper.  “Suggest actions” may be useful if you’re trying to think of questions that could be asked based on the paper.  These, again, might come in handy in the later stages of preparing for your comprehensive exams. 4. Reducing wordcountsMy first drafts are often too long. This is especially noticeable for abstracts, which usually have word limits of 250 or even 200 words. Recently, I gave ChatGPT the abstract for a literature review I’ve been working on, which was well over 300 words. I told ChatGPT to reduce the abstract to 250 words. ChatGPT did an excellent job, cutting sentences that didn’t need to be there while retaining the main points I wanted to communicate. The final word count was 232 words.  I also tried this on my literature review itself, feeding ChatGPT one paragraph at a time. This turned out less successful. It indeed reduced the word count of each paragraph, but often cut pieces of information that I saw as essential to understanding the paper. Ultimately, going through my literature review and carefully considering the wording of each sentence myself took less effort than correcting each output that ChatGPT gave me. There are two lessons here: 1) ChatGPT can help revise shorter pieces but maybe not longer pieces; and 2) always double-check the work that ChatGPT (and AI in general) gives you. I also asked ChatGPT to suggest titles for my literature review based on the content of my abstract. Here’s what it gave me:  Not all of these were good fits, but they were pretty close, and helped get my brain moving on coming up with a title myself. ChatGPT is the friend you always wished you had who you can endlessly bounce ideas off of without worrying about wasting their time. 5. Literature searching like you’ve always wantedI don’t know if it’s just me, but I sometimes find myself frustrated by the results I get when performing literature searches on search engines like PubMed or Google Scholar. Don’t get me wrong, I’ve fine-tuned the process for those databases and have gotten great results. By linking together certain keywords with a “____” AND “____” format, PubMed usually helps me find the papers I’m looking for. The problem is, sometimes it doesn’t, or at least it isn’t immediately clear why it gave me a certain paper in the search results. Usually, I have to open the paper, then comb through to see if it has the information I need. This process works, but I’ve always wondered if it could be more streamlined. There is a new AI tool called Consensus. You start by typing in the exact question behind your literature search. Based on that question, Consensus will not only suggest papers, it will highlight snippets from the text of each paper that directly answer your question. No more guessing games!  Additionally, if you click “Synthesize,” Consensus will summarize the findings of the suggested papers to give a consensus on your question. It will also provide a Consensus Metre to demonstrate any conflicting findings in the literature.  It’s important to note that this should not be a replacement of classic literature search techniques, but rather—like all the AI examples I’ve presented here—a tool to enhance existing practices. Conclusion  Almost every day I find a new AI tool that makes me wonder how I can streamline my tasks as a graduate student. There are limitations that we should be cautious about at the moment, but at the same time, with how quickly AI is evolving, many of the limitations I mentioned above could very well be addressed a year from now. My recommendation: try out the ideas I’ve suggested here, explore your own ideas as well, and try to have fun! Bonus: Asking ChatGPT silly questions that will make you laughDuring a one-hour break on a long day of data collection, my colleague and I were too exhausted to do anything productive. Our brain capacity would not extend beyond playing around with ChatGPT, so we asked it silly questions. For example… 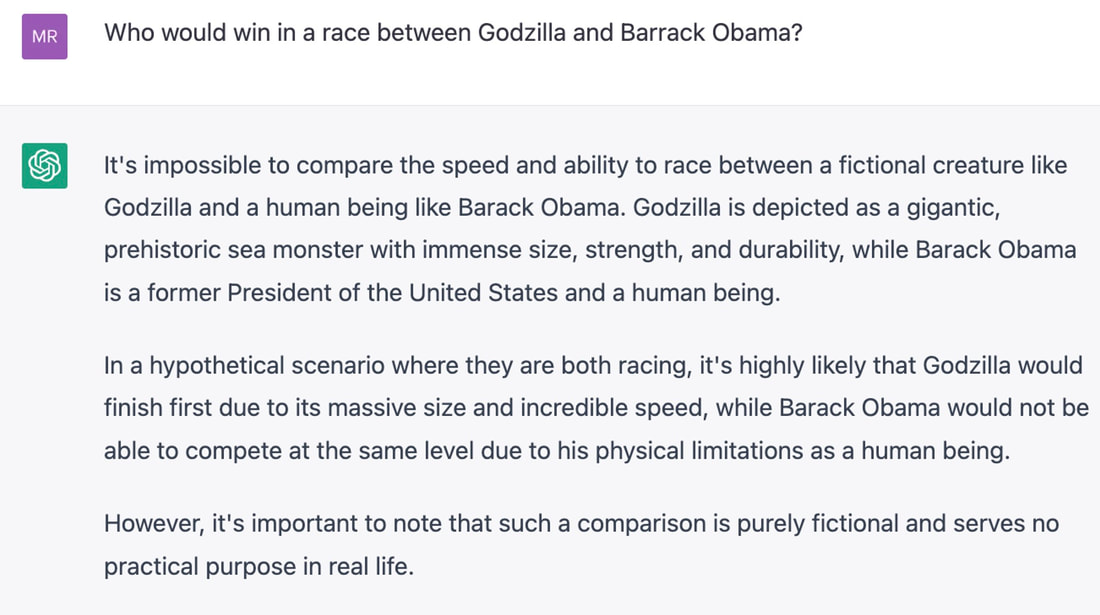 It quickly got out of hand, but ChatGPT kindly played along. 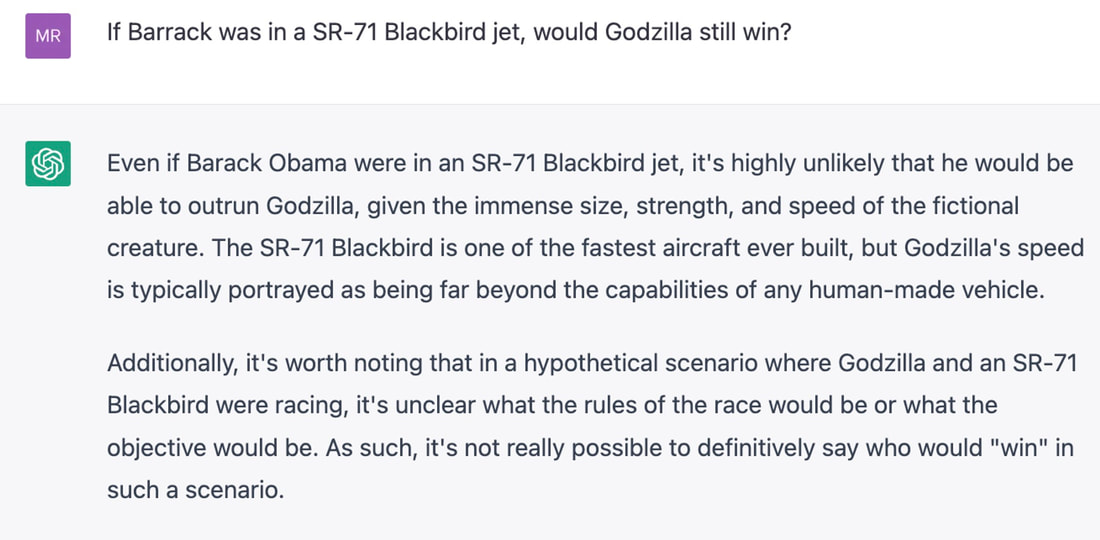     By Dr. Geoff Power  You may have heard the phrase ‘old man strength’ often used in the context of someone performing a physical task seemingly above the level of performance you would expect for their age. To describe this phenomenon, the urban dictionary has used phrasing such as “The uncanny ability of older men to lift copious amounts of lumber, heavy furniture and beat their sons in arm wrestling”. You may have even overheard or had similar conversations as: “My dad beat me in arm wrestling again”, - ‘of course, he has old man strength”. In this article I will highlight one aspect of the human neuromuscular system which seems to resist the deleterious effects of age, the age-related maintenance of eccentric strength. 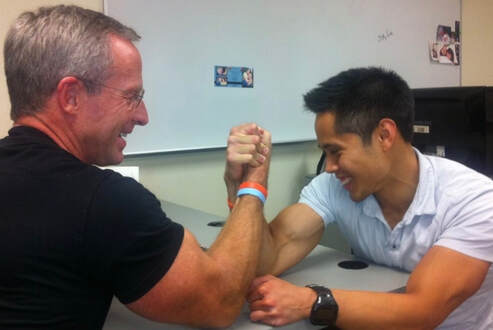 On one hand, natural adult aging is associated with many ‘negative’ alterations to the neuromuscular system resulting in muscle weakness and impaired functional performance of everyday tasks. Some of these changes include a loss of muscle mass through the death and dysfunctional remodelling of motor units (the basic ‘functional’ contractile unit consisting of the motor neuron housed in the spinal cord and its associated muscle fibres). 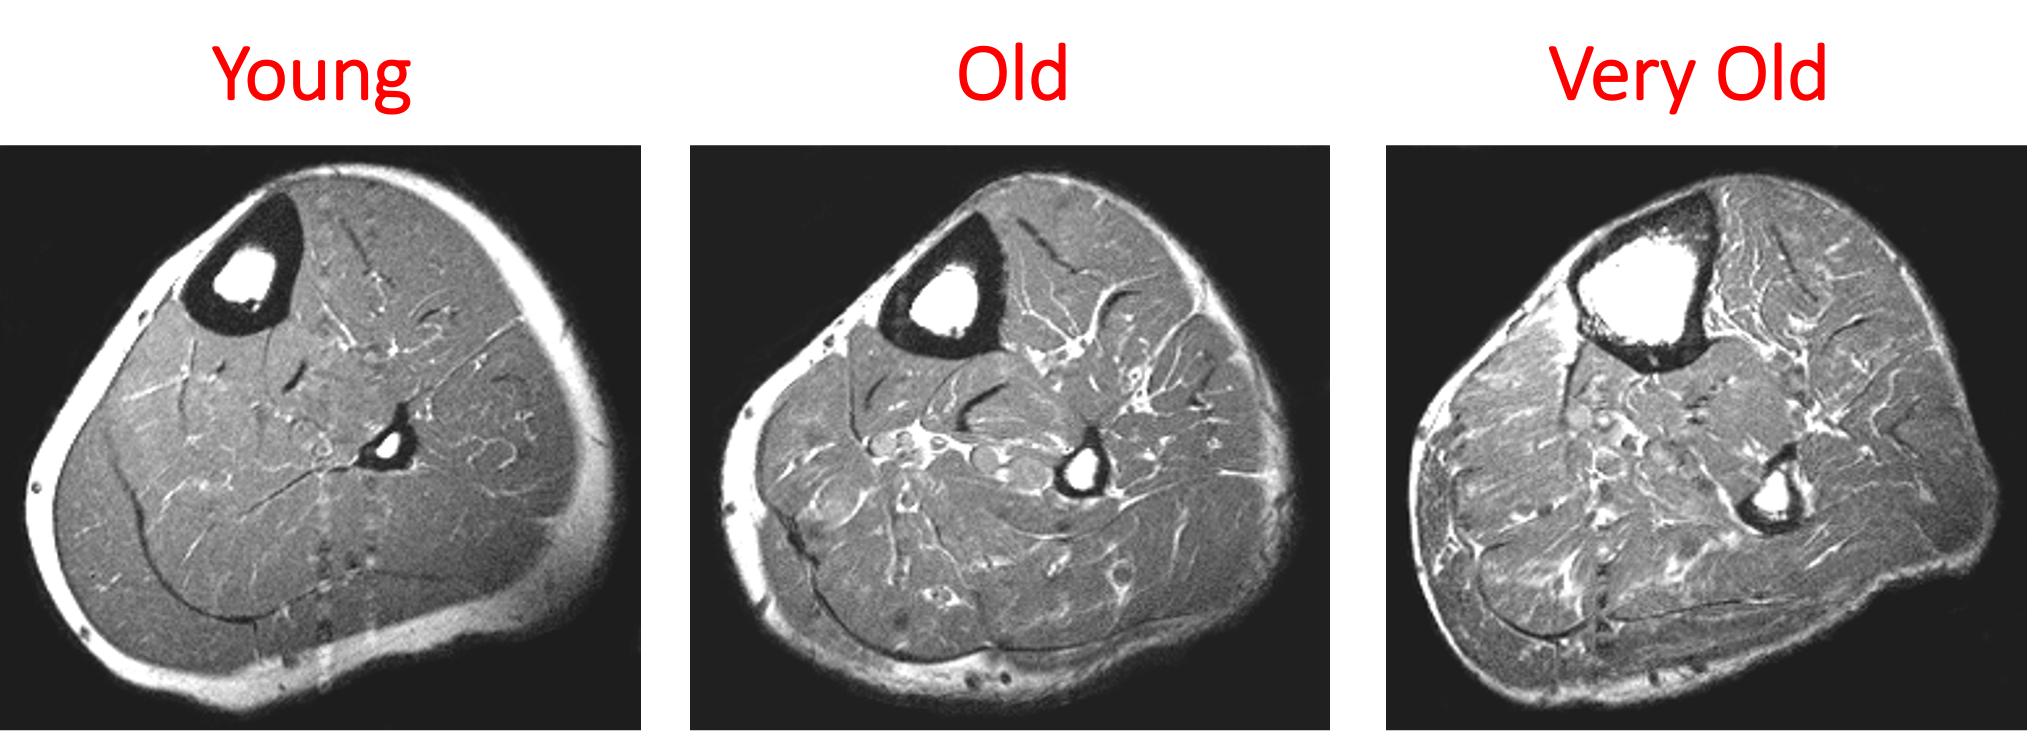 Figure: From youth to old age, there is a loss of contractile muscle tissue, and infiltration of fat and non-contractile tissue contributing to muscle weakness and impairments in muscle performance. A reduced ability to activate the remaining muscle mass through a reduction in the fidelity of the neural signals from the from the brain to the muscle. As well, owing to reductions in strength and speed of muscle contraction, power is drastically impaired. Importantly, it is power that is critical to performing daily tasks such as rising from a chair or walking up a flight of stairs. 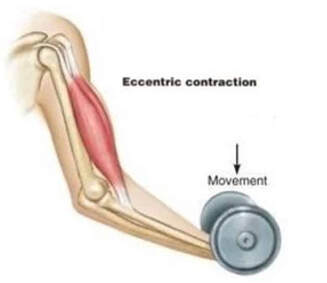 On the other hand, while many of the ‘negative alterations’ to the aging neuromuscular system are evident during static or shortening muscle actions, during lengthening actions (see our previous Knowledge Translation), performance is well-maintained to that of younger adults. A lengthening muscle action (or eccentric contraction) is unique in that the muscle generates an internal tension which is less than the external load, thus the muscle actively lengthens. Eccentric contractions are part of everyday movements such as walking down a flight of stairs, and older adults have elevated performance (relative to other contraction modes) and in some instances equal that of a healthy young adult. 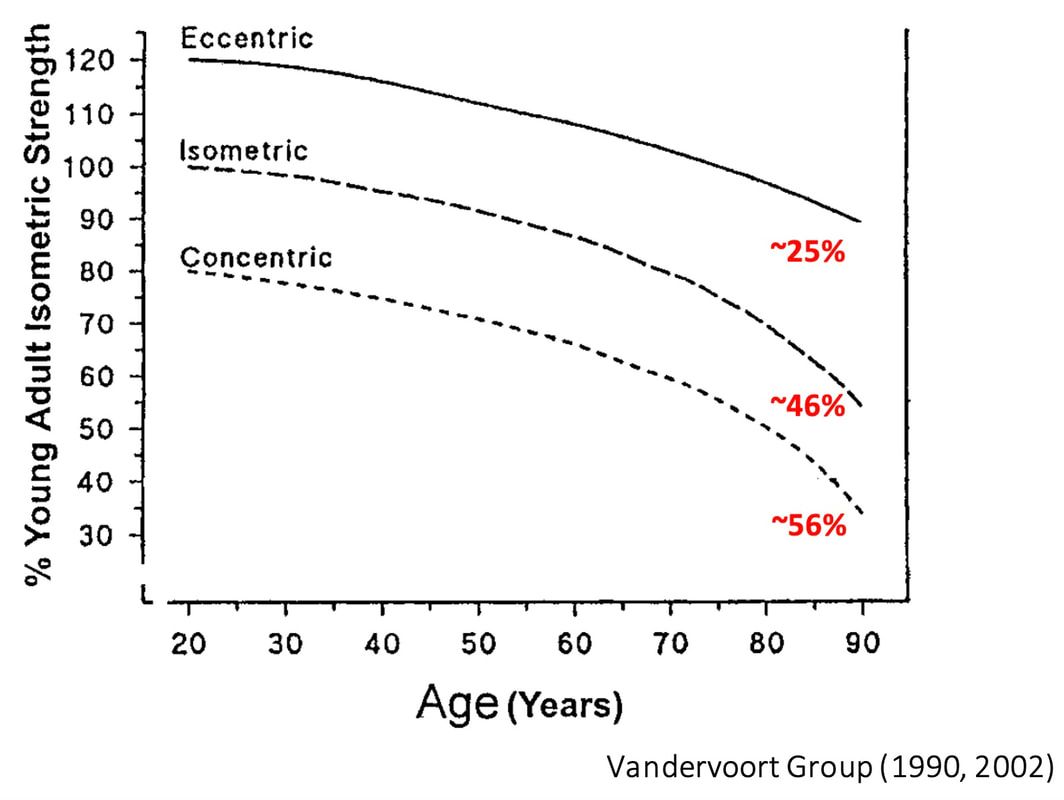 Figure: The above graph shows the age-related loss of strength during 3 distinct contraction types relative to a young adult: Static (isometric), shortening (concentric), and lengthening (eccentric). The largest deficits occur over time for the shortening contractions, which is a proxy of power. Static contractions show a similar but less drastic decline, and Eccentric contraction strength is well-maintained far into old age. Some of the suggested mechanisms contributing to a maintenance of eccentric strength in old age include: 1) An increase in non-contractile tissue infiltration such as collagen content/cross-linking. This means less contractile tissue is contributing to force during static and shortening contractions, impairing performance when the muscle is responsible for generating tension. However, more structures now ‘resist’ the external load during the lengthening (eccentric) contraction, increasing performance. The elevated passive stiffness of muscle in old age could also increase the effective ‘storage’ of elastic energy to optimize force production. 2) Eccentric contractions require less voluntary neural activation, meaning there is less of an impairment during lengthening contractions compared to static and shortening contractions. 3) There is an overall slowing of cross-bridge kinetics and increased proportion of weakly bound cross-bridges in old compared to young muscle. As active force generation depends on the number of strongly bound cross-bridges, any reduction or weakening of these cross-bridges will lessen active force generation. However, when external tension is applied, as in the case of a lengthening contraction, this cross-bridge configuration is optimized to resist active lengthening, and generate high forces. Work from our lab investigated the effects of slowing muscle cross-bridge kinetics, and biasing the cross-bridge configuration to more weakly bound states on the age-related maintenance of eccentric strength. We found that we could make young muscle act like old muscle when the muscle temperature was reduced to cause a slowing of muscle contraction. Therefore, if we look to interventions to reverse some of the age-related slowing of muscle contractile properties, we may identify strategies to improve power and performance during activates of daily living. 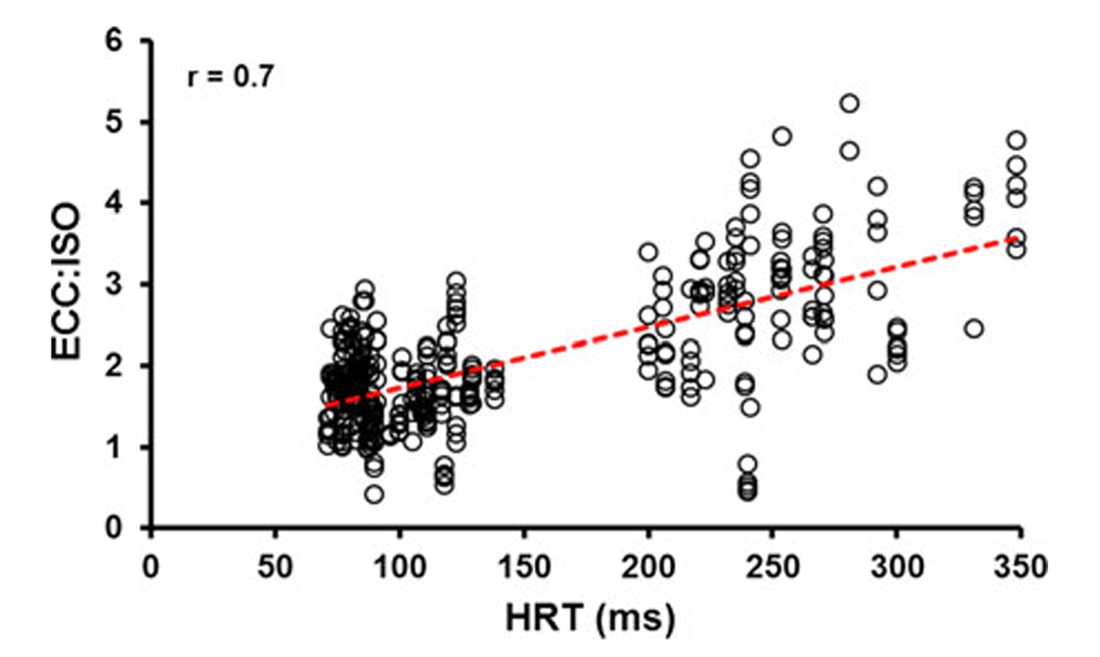 Figure: The relationship between muscle relaxation speed (HRT) and the ratio of eccentric to isometric force. There was a strong relationship between muscle speed and the maintenance of eccentric strength such that individuals with slower muscle properties had a greater eccentric to isometric force ratio. To resist the aging process, there may be some truth in just being stubborn to the natural degeneration of the neuromuscular system. “It's called stubborn-ness. He's more stubborn to push the weights against gravity than gravity is in pulling them down. We should all be so stubborn.” Either way you look at it, aging of the human neuromuscular system is a non-linear process and there are some impressive mechanisms behind the scenes fighting to maintain function and independence into old age.  |
AuthorAvery Hinks Archives
September 2023
Categories |
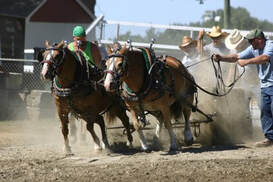
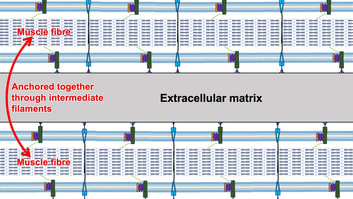
 RSS Feed
