|
By Avery Hinks In research on humans, we are often limited to obtaining indirect measurements of muscle structure, with direct measurements being too invasive for our participants. Animal research permits more invasive techniques, including dissecting out the muscles to be studied. Unfortunately, whether indirect measures in humans accurately represent the more direct measures obtained from animals is largely unknown. In our lab’s recent publication in the journal Experimental Physiology titled “Ultrasonographic measurements of fascicle length overestimate adaptations in serial sarcomere number,” we addressed this area of uncertainty. Sport research prominently uses two fundamental concepts of muscle function to characterize performance. These are the Force-Length Relationship and the Force-Velocity Relationship. 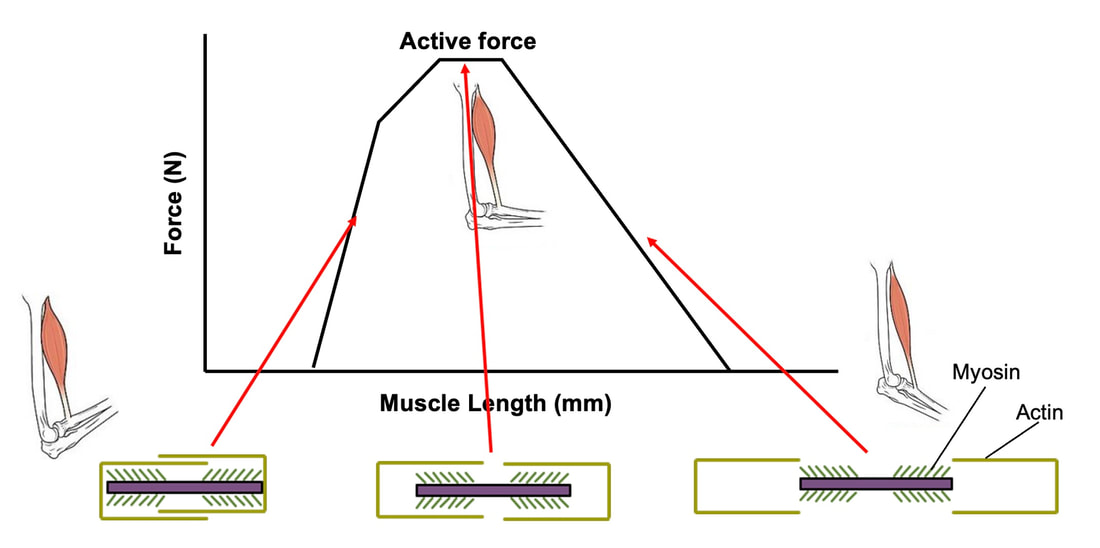 The Force-Length Relationship (above) dictates that a muscle produces suboptimal force (or in other words strength) if it is too shortened (shown on the left) or too stretched (shown on the right). The amount of force a muscle can produce depends on the alignment of the muscle’s tiny sarcomeres, those purple and green rectangles under the graph above. When the sarcomere’s myosin and actin proteins overlap perfectly (like in the middle sarcomere above), the muscle produces its maximum possible force. 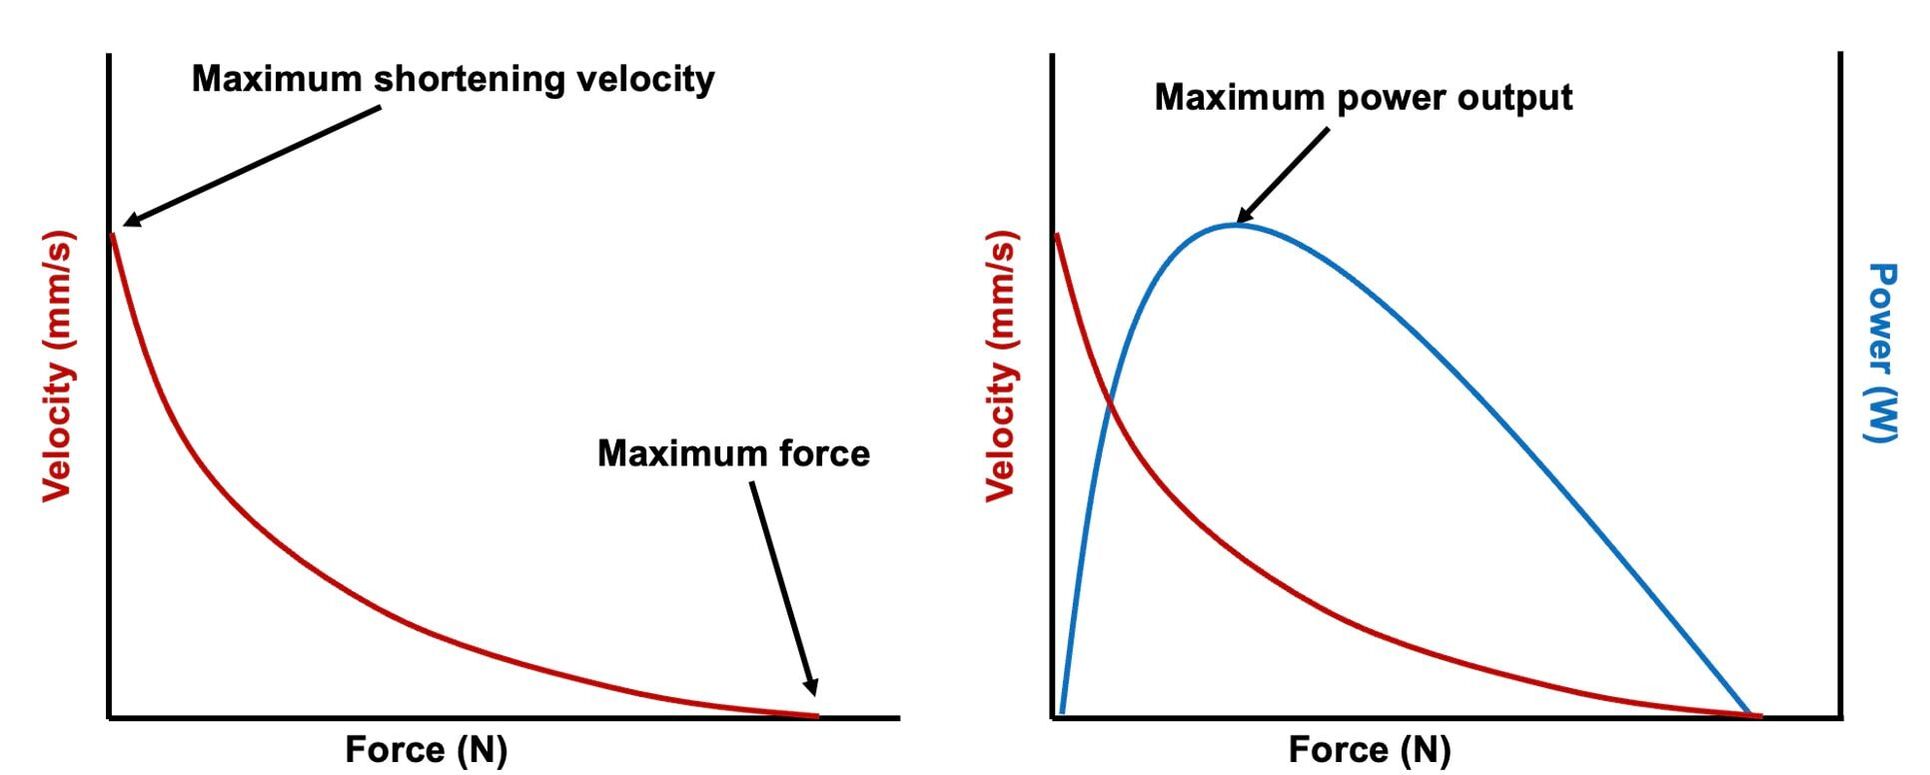  The Force-Velocity Relationship (on the left above) dictates that as a muscle shortens faster, its ability to produce force decreases. This reduction in force with increasing speed occurs because as actin and myosin proteins slide past each other faster, they become less likely to bind. Since there is a trade-off between a muscle’s strength and speed, “power” is often used to measure a muscle’s performance during movement. Power equals a muscle’s force multiplied by its velocity, and because of that (as shown above on the right), maximum power output occurs when force and velocity are both moderate. The sarcomere is the obvious commonality between the Force-Length and Force-Velocity-Power relationships of muscle. If we scale this up to the level of a whole muscle, we must consider the “serial sarcomere number,” which is the number of sarcomeres sitting side by side along the length of the muscle. To paint a better picture of what that looks like, consider this: at optimal muscle length, a human sarcomere is approximately 2.6 µm (or 0.00026 cm) long, and a whole human muscle such as the biceps brachii can be about 11 cm long. That means over 40000 sarcomeres could run from end to end along the human bicep muscle. 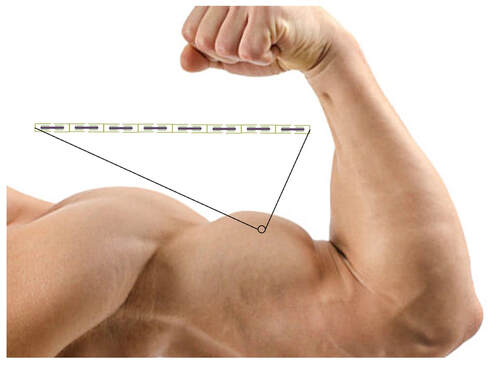 So, if we are to understand why a muscle’s performance improves with resistance training or declines with age, measuring adaptations in serial sarcomere number should provide insight, right? That’s the problem…we can’t really measure serial sarcomere number in humans. Measurement of muscle structure in animals versus humans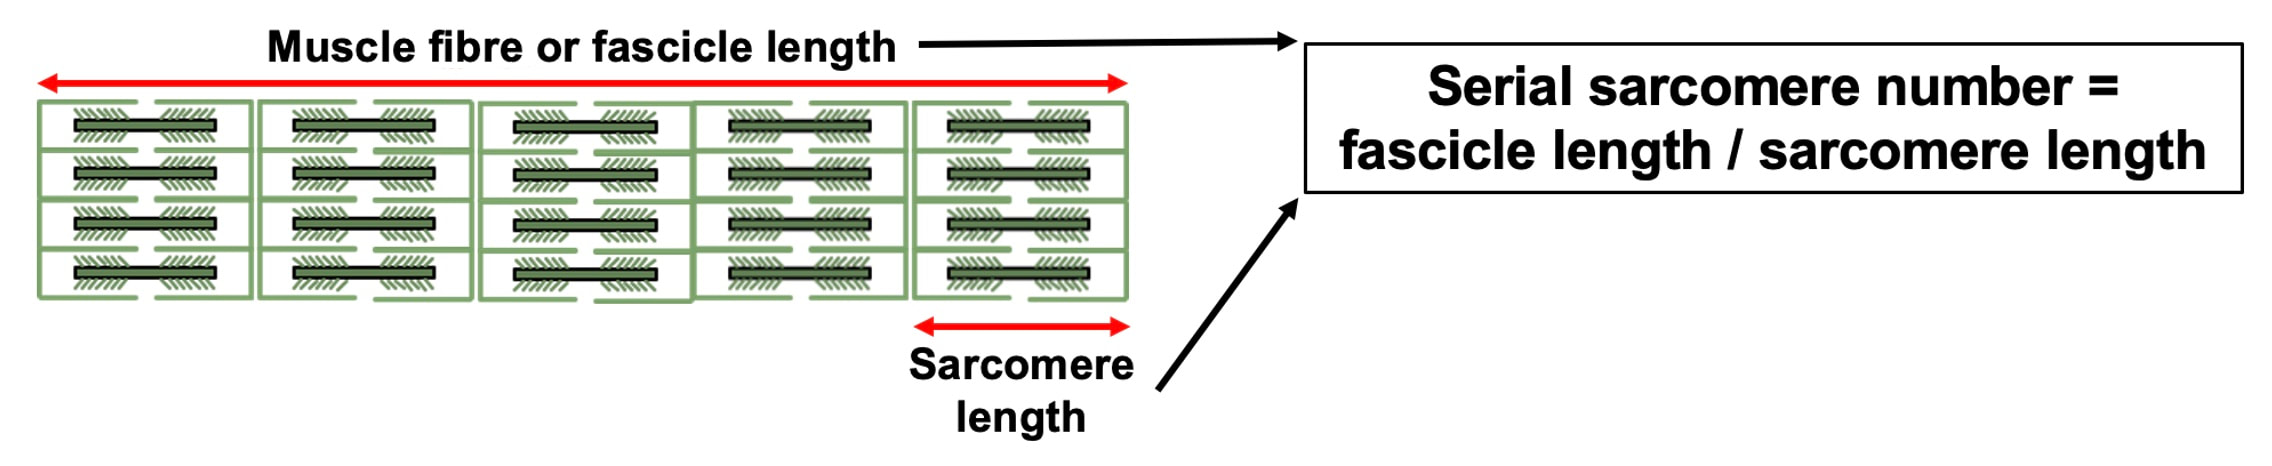 Because a muscle has thousands of sarcomeres, serial sarcomere number is calculated (see the equation above) rather than counted. To do this, we need to two numbers: the average length of the muscle’s fibre or fascicle, and the average length of the sarcomere in the muscle. 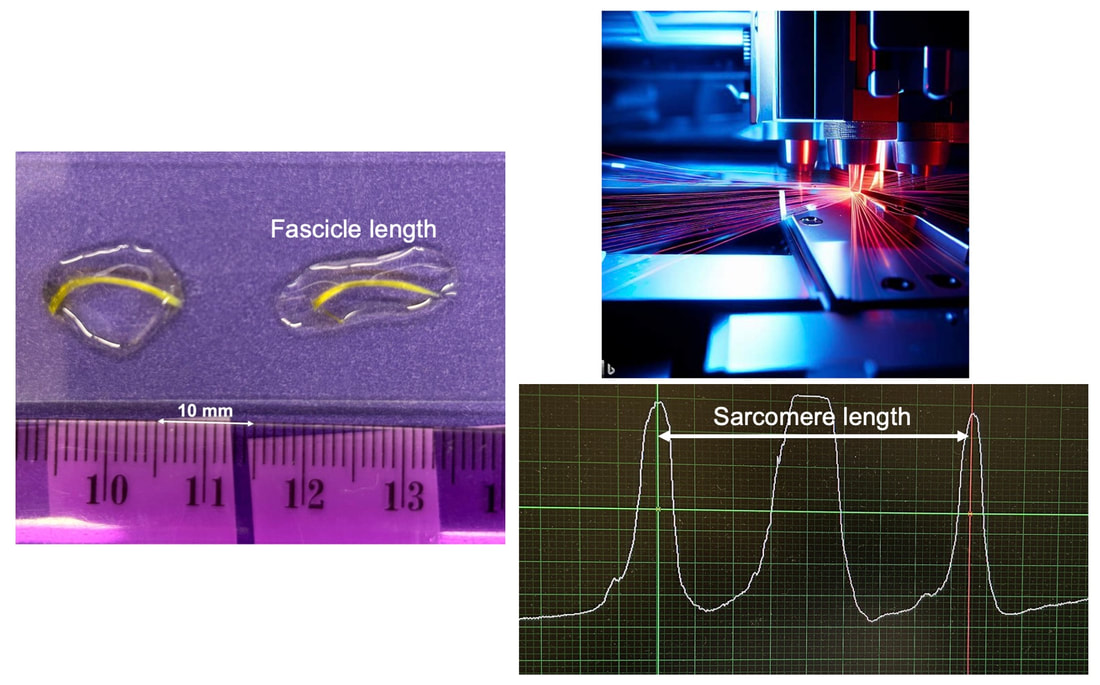 In rats and mice, performing this calculation is easy. We can dissect out the muscle of interest. We can then tease the muscle apart to obtain individual fascicles, which we can then measure the length of from end to end (on the left above). Lastly, we can measure the sarcomere length within that fascicle using a tool called “laser diffraction,” in which a laser is shone through the fascicle (on the right above). We of course cannot dissect a human’s muscles out of their body, and therefore cannot shine a laser through their fascicles either. Some studies have had the opportunity to perform such measurements on humans during surgeries, but that is rarely available. 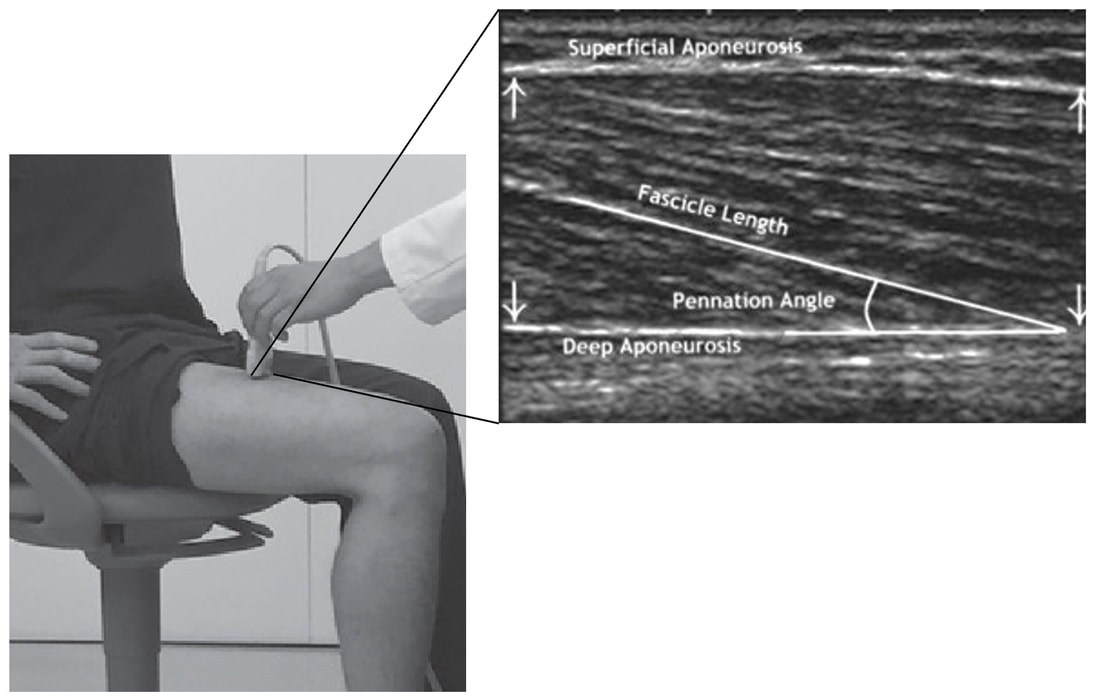 In humans, we typically measure a muscle’s structure by performing ultrasound (the probe being applied to the leg above). From ultrasound, we obtain an image depicting a muscle’s fascicles. A muscle fascicle is, as discussed earlier, comprised of many sarcomeres aligned in series. It follows that measurement of “fascicle length” with ultrasound (as shown on the right above) is often used as a proxy for serial sarcomere number in human muscle. However, without knowing a muscle’s sarcomere length at the position in which ultrasound images were obtained, we cannot be certain that fascicle length is representing serial sarcomere number. Consider the example below. Let’s say we measure fascicle length of the vastus lateralis (a thigh muscle) with the knee at a 90° angle. We obtain a measurement of fascicle length. This individual’s sarcomeres could be a neutral length (A) at this knee angle, but they could also be more shortened (B) or more stretched (C). If we do the math, it’s clear each of these possibilities would yield a different serial sarcomere number. We don’t know for certain. 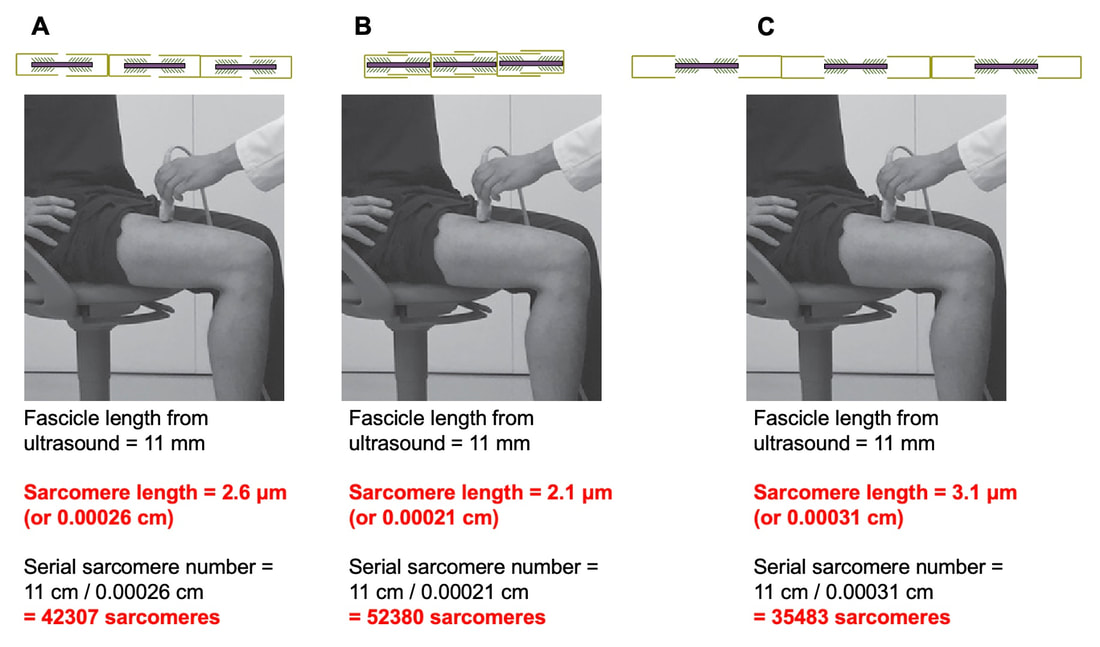 This becomes a BIG problem when attempting to explain functional declines with age or functional improvements with sports. If an elderly individual’s muscle begins to become slower or less powerful, but ultrasound measurements show a “normal” fascicle length when in fact they’ve lost sarcomeres, we are missing an important piece of the puzzle. Still, ultrasound is a relatively easy, non-invasive method, so our lab wasn’t ready to discount it. That’s what led us to our study published in Experimental Physiology. Using rats to validate ultrasound as a predictor of serial sarcomere numberUltrasound can be performed on the muscles of rats, too. So, what if we measure muscle fascicle length using ultrasound, then dissect out that muscle and perform serial sarcomere number measurements using laser diffraction? That’s exactly what we did. 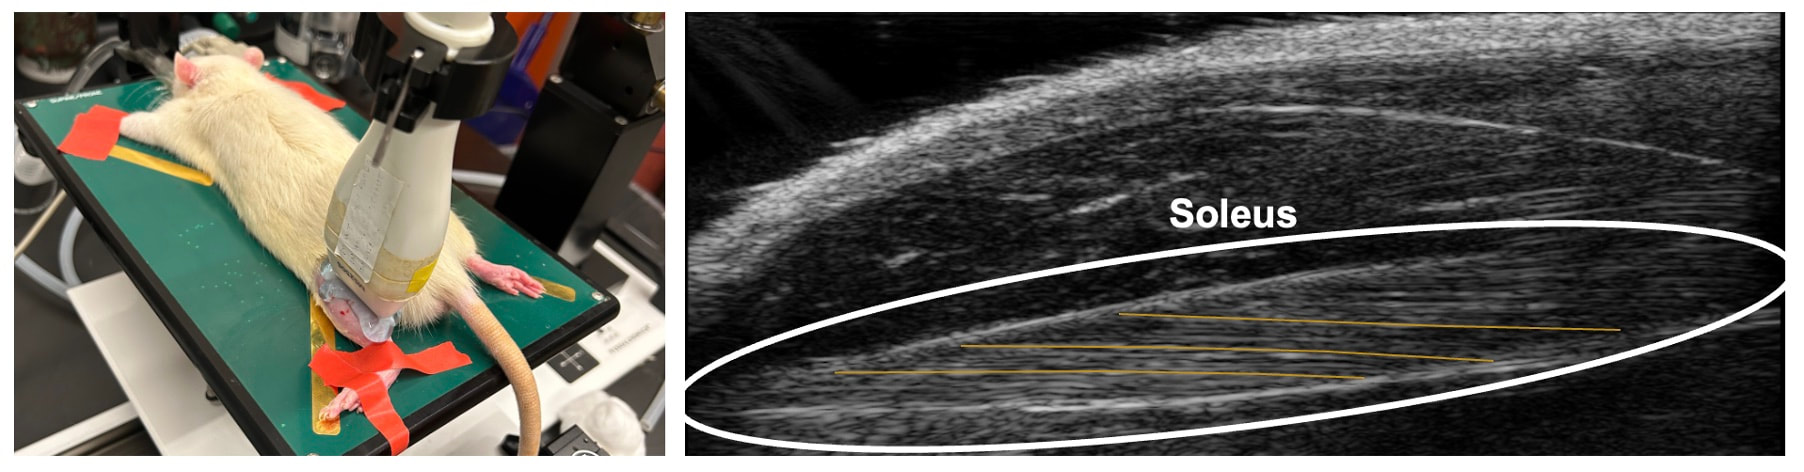 We also wanted to test the ability for ultrasound to detect serial sarcomere number adaptations, not just serial sarcomere number alone. To do this, we casted the rat’s ankle in a dorsiflexed position, stretching the calf muscles (the muscles you’d use to stand on your toes), for two weeks. This casting intervention’s chronic stretch has consistently increased serial sarcomere number in previous studies on rats. We performed ultrasound measurements on the soleus, which is the calf muscle most affected by this intervention. 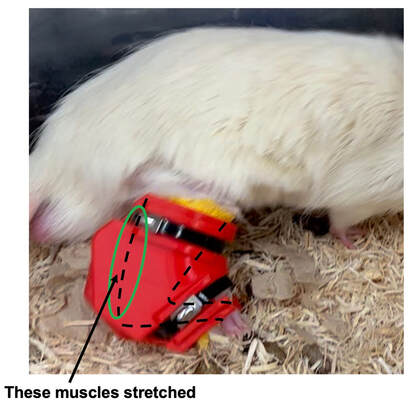 After two weeks, we removed the cast, then dissected out the soleus of both the casted and un-casted legs. By obtaining both soleus muscles, we could measure the percent increase in serial sarcomere number from the un-casted to the casted leg. We could then compare this percent increase to the percent increase in fascicle length detected by ultrasound from pre to post-cast. 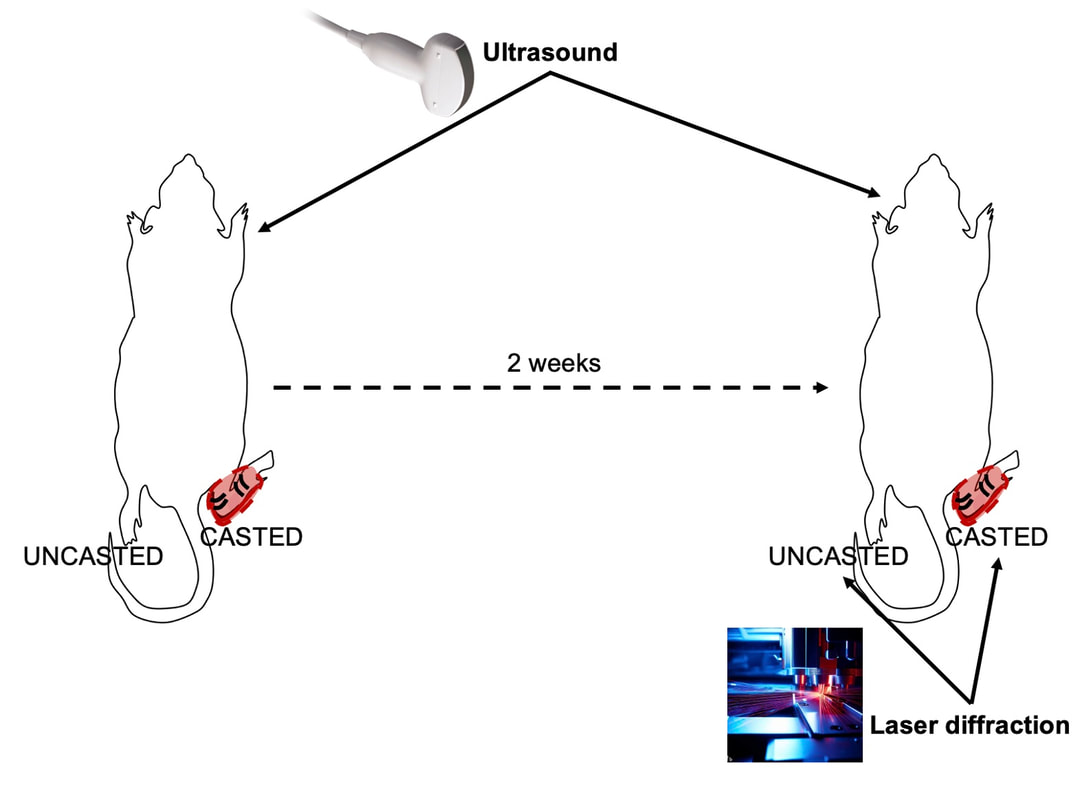 Even further, we obtained ultrasound measurements at two different ankle positions: a neutral position (with the ankle at 90°) and a fully stretched position. We also took measurements at three regions along the soleus: proximal (closer to the knee), middle, and distal (closer to the ankle). By taking these extra steps, we hoped to determine which joint positions and regions of muscle provided the best estimate of actual serial sarcomere number adaptations. Did fascicle length adaptations detected by ultrasound correspond to adaptations in actual serial sarcomere number?The graphs below show fascicle length measured by ultrasound from pre to post-cast for the casted soleus (top) and the un-casted soleus (bottom). In the casted soleus, we detected an overall 11% increase in fascicle length. This 11% increase was consistent across the two joint positions, but was most pronounced in middle and distal soleus fascicles. In the un-casted soleus, we detected no changes in fascicle length from pre to post-cast, which reassured that we could use that muscle as the control in our serial sarcomere number comparisons. 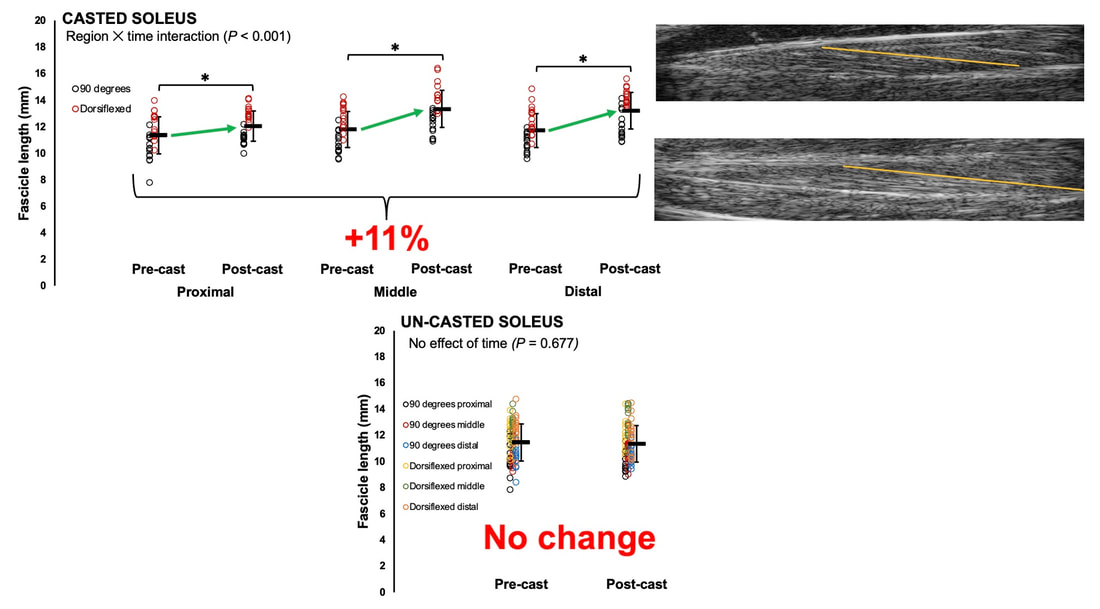 But how did these adaptations detected by ultrasound compare to the actual serial sarcomere number adaptations? The graph below shows that we indeed detected an increase in serial sarcomere number from the un-casted to the casted leg. However, the increase was only 6%. That’s 5% less than the increase detected by measuring fascicle length with ultrasound. 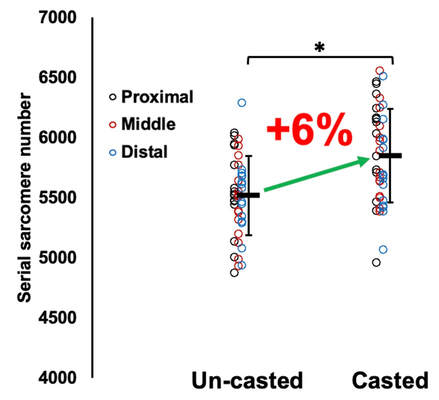 We also conducted an analysis to see if fascicle length measured by ultrasound related to actual serial sarcomere number across both legs. While the relationships were statistically significant, they were weak. By looking at the R^2 values (an indicator of the strength of a relationship), we also saw that fascicle length measurements in a neutral position (left below) better corresponded to actual serial sarcomere number than measurements in a fully stretched position (right below). 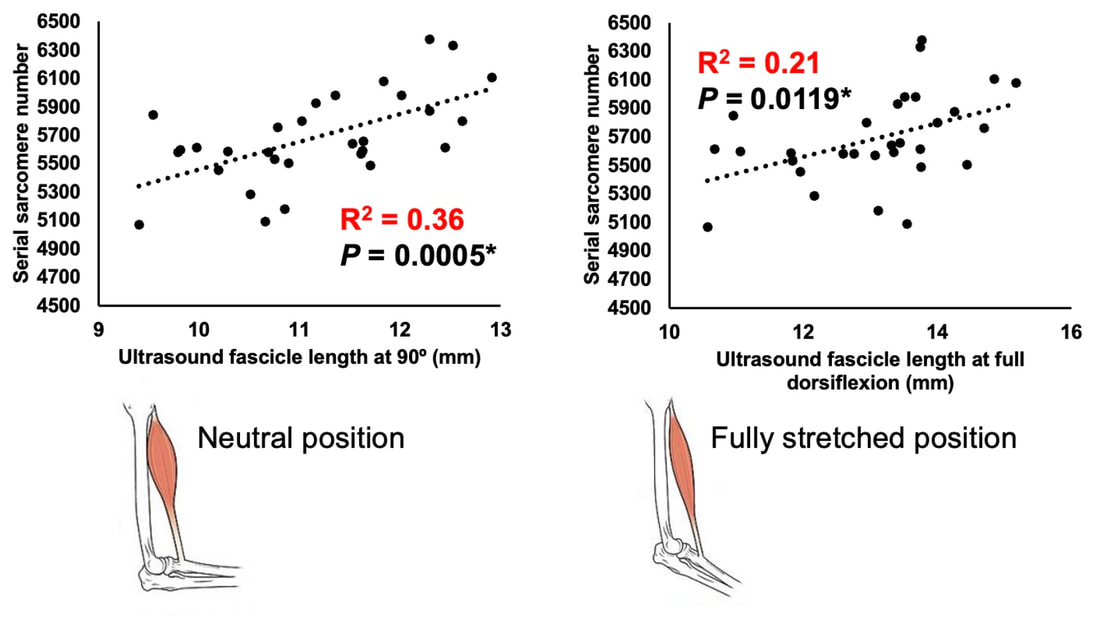 Altogether, this study provided two important take aways:
Future directions of this workWhile this study directly answered our question of whether ultrasound measurements of fascicle length correspond to actual serial sarcomere number, we shouldn’t stop here. It seems that a correction factor needs to be applied when estimating serial sarcomere number adaptations from ultrasound-derived fascicle length measurements. To further build on the 5% correction factor we observed, future studies should perform similar investigations in other muscles, interventions, and animal models. For example, using a 1 or 4-week duration instead of 2 weeks, employing a training intervention, or investigation sarcomere loss after a period of disuse. These altogether will help strengthen applicability to human populations, and improve our understanding of how adaptations in muscle structure influence muscle function. 
0 Comments
|
AuthorAvery Hinks Archives
September 2023
Categories |
 RSS Feed
